hawx1993 / Wxapp Charts
🏹微信小程序图表charts组件
Stars: ✭ 201
Programming Languages
javascript
184084 projects - #8 most used programming language
Labels
Projects that are alternatives of or similar to Wxapp Charts
Picasso.js
A charting library streamlined for building interactive visualizations for the Qlik product suites.
Stars: ✭ 175 (-12.94%)
Mutual labels: chart
Vue Orgchart
It's a simple and direct organization chart plugin. Anytime you want a tree-like chart, you can turn to OrgChart.
Stars: ✭ 182 (-9.45%)
Mutual labels: chart
Charts
⚡ Laravel Charts — Build charts using laravel. The laravel adapter for Chartisan.
Stars: ✭ 2,337 (+1062.69%)
Mutual labels: chart
Ilgizar Candlestick Panel
Grafana candlestick panel plugin
Stars: ✭ 175 (-12.94%)
Mutual labels: chart
Orgchart
It's a simple and direct organization chart plugin. Anytime you want a tree-like chart, you can turn to OrgChart.
Stars: ✭ 2,325 (+1056.72%)
Mutual labels: chart
K8s Wait For
A simple script that allows to wait for a k8s service, job or pods to enter a desired state
Stars: ✭ 172 (-14.43%)
Mutual labels: chart
Swiftcharts
Easy to use and highly customizable charts library for iOS
Stars: ✭ 2,336 (+1062.19%)
Mutual labels: chart
Smoothie
Smoothie Charts: smooooooth JavaScript charts for realtime streaming data
Stars: ✭ 2,145 (+967.16%)
Mutual labels: chart
V Chart Plugin
Easily bind a chart to the data stored in your Vue.js components.
Stars: ✭ 188 (-6.47%)
Mutual labels: chart
Computator.net
Computator.NET is a special kind of numerical software that is fast and easy to use but not worse than others feature-wise. It's features include: - Real and complex functions charts - Real and complex calculator - Real functions numerical calculations including different methods - Over 107 Elementary functions - Over 141 Special functions - Over 21 Matrix functions and operations - Scripting language with power to easy computations including matrices - You can declare your own custom functions with scripting language
Stars: ✭ 174 (-13.43%)
Mutual labels: chart
Tui.editor
🍞📝 Markdown WYSIWYG Editor. GFM Standard + Chart & UML Extensible.
Stars: ✭ 14,016 (+6873.13%)
Mutual labels: chart
Jira Dependency Graph
Graph visualizer for JIRA tickets' dependencies
Stars: ✭ 194 (-3.48%)
Mutual labels: chart
Graphic
A Flutter data visualization library based on Grammar of Graphics.
Stars: ✭ 173 (-13.93%)
Mutual labels: chart
Plotjuggler
The Time Series Visualization Tool that you deserve.
Stars: ✭ 2,620 (+1203.48%)
Mutual labels: chart
Sprite
🖌 Draw charts in code. Render in real-time. Embed anywhere as .png.
Stars: ✭ 201 (+0%)
Mutual labels: chart
wxapp-charts
微信小程序图表charts组件
Usage
        data: {
                charts: {
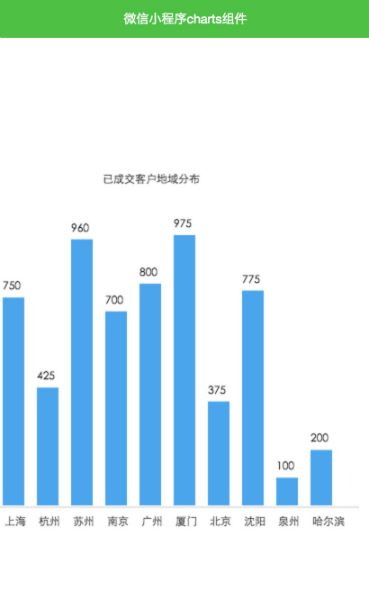
                    area: ["上海,750","杭州,425","苏州,960","南京,700","广州,800","厦门,975","北京,375","沈阳,775","泉州,100","哈尔滨,200"],
                    pieData: [10, 25, 35, 30]
                }
            }

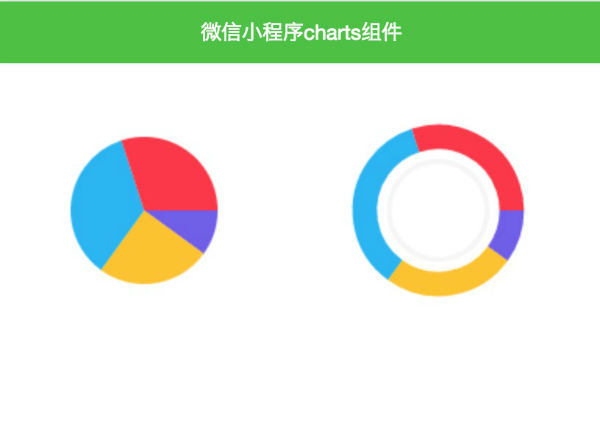
            //饼图
        new Charts({
            type: "pie",
            data: this.data.charts.pieData,
            colors: ["#7158ec", "#fec312", "#1db2f4", "#ff3444"],
            canvasId: 'canvas1',
            point: {
                x: 150,
                y: 150
            },
            radius : 100
        });
        //圆环图
        new Charts({
            type: "ring",
            data: [10, 25, 35, 30],
            colors: ["#7158ec", "#fec312", "#1db2f4", "#ff3444"],
            canvasId: 'canvas2',
            point: {
                x: 150,
                y: 150
            },
            radius : 100
        });

        //柱状图
        new Charts({
            type: 'bar',
            data: this.data.charts.area,
            bgColors: "#46a2ef",
            color: '#383838',
            cHeight: 300,//表格高度
            cWidth: 500,//表格宽度
            bWidth: 22,//柱子宽度
            bMargin: 16,//柱子间距
            showYAxis: false,//是否显示Y轴
            xCaption: 'x轴说明文字',
            yCaption: 'y轴说明文字',
            canvasId: 'chartContainer'
         });
参数说明
    type: -支持pie,ring,bar
    data: []
    colors: []颜色
    canvasId: canvas-id
    point:x轴圆心坐标,y轴圆心坐标
    radius:半径大小
    xCaption: 水平坐标说明文字
    yCaption: 纵坐标说明文字
    showYAxis:是否显示y轴
更新说明
- 增加data对外接口
- 添加部分API,如cWidth等
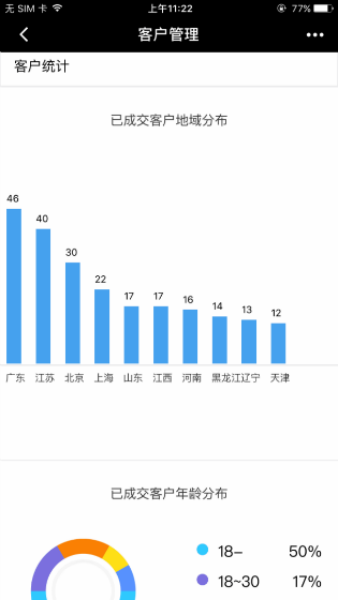
效果如图所示
手机端效果
Note that the project description data, including the texts, logos, images, and/or trademarks,
for each open source project belongs to its rightful owner.
If you wish to add or remove any projects, please contact us at [email protected].


