ujjwalkarn / Xda
Programming Languages
Projects that are alternatives of or similar to Xda
xda: R package for exploratory data analysis
This package contains several tools to perform initial exploratory analysis on any input dataset. It includes custom functions for plotting the data as well as performing different kinds of analyses such as univariate, bivariate and multivariate investigation which is the first step of any predictive modeling pipeline. This package can be used to get a good sense of any dataset before jumping on to building predictive models.
The package is constantly under development and more functionalities will be added soon. Pull requests to add more functions are welcome!
The functions currently included in the package are mentioned below:
-
numSummary(mydata)function automatically detects all numeric columns in the dataframemydataand provides their summary statistics -
charSummary(mydata)function automatically detects all character columns in the dataframemydataand provides their summary statistics -
Plot(mydata, dep.var)plots all independent variables in the dataframemydataagainst the dependant variable specified by thedep.varparameter -
removeSpecial(mydata, vec)replaces all special characters (specified by vectorvec) in the dataframemydatawithNA -
bivariate(mydata, dep.var, indep.var)performs bivariate analysis between dependent variabledep.varand independent variableindep.varin the dataframemydata
More functions to be added soon.
Note: All functions mentioned above expect mydata to be a data.frame - please convert your input dataset to a data.frame before using any function from this package.
Installation
-
The best way to install
xdapackage is to installdevtoolspackage first. To installdevtools, please follow instructions here. Then, use the following commands to installxda:library(devtools) install_github("ujjwalkarn/xda")
-
Alternatively, you may also use the
githubinstallpackage for installingxda:install.packages("githubinstall") library(githubinstall) githubinstall("xda")
Usage
For examples below, the popular iris dataset and the warpbreaks dataset has been used. Please refer to the documentation of each function to understand how to use it. For example, to see the documenation for the numSummary() function, use ?numSummary.
## load the package into the current session

library(xda)
numSummary()
## to view a comprehensive summary for all numeric columns in the iris dataset

numSummary(iris)

## n = total number of rows for that variable
## nunique = number of unique values
## nzeroes = number of zeroes
## iqr = interquartile range
## noutlier = number of outliers
## miss = number of rows with missing value
## miss% = percentage of total rows with missing values ((miss/n)*100)
## 5% = 5th percentile value of that variable (value below which 5 percent of the observations may be found)
## the percentile values are helpful in detecting outliers
Output
> numSummary(iris)

                n mean    sd max min range nunique nzeros  iqr lowerbound upperbound noutlier kurtosis skewness mode miss miss%   1%   5% 25%  50% 75%  95%  99%
 Sepal.Length 150 5.84 0.828 7.9 4.3   3.6      35      0 1.30       3.15       8.35        0   -0.606    0.309  5.0    0     0 4.40 4.60 5.1 5.80 6.4 7.25 7.70
 Sepal.Width  150 3.06 0.436 4.4 2.0   2.4      23      0 0.50       2.05       4.05        4    0.139    0.313  3.0    0     0 2.20 2.34 2.8 3.00 3.3 3.80 4.15
 Petal.Length 150 3.76 1.765 6.9 1.0   5.9      43      0 3.55      -3.72      10.42        0   -1.417   -0.269  1.4    0     0 1.15 1.30 1.6 4.35 5.1 6.10 6.70
 Petal.Width  150 1.20 0.762 2.5 0.1   2.4      22      0 1.50      -1.95       4.05        0   -1.358   -0.101  0.2    0     0 0.10 0.20 0.3 1.30 1.8 2.30 2.50
charSummary()
## to view a comprehensive summary for all character columns in the warpbreaks dataset

charSummary(warpbreaks)

## n = total number of rows for that variable
## miss = number of rows with missing value
## miss% = percentage of total rows with missing values ((n/miss)*100)
## unique = number of unique levels of that variable
## top5levels:count = top 5 levels (unique values) in each column sorted by count
## for example, wool has 2 unique levels 'A' and 'B' each with count of 27
Output
> charSummary(warpbreaks)

          n miss miss% unique top5levels:count
 wool    54    0     0      2       A:27, B:27
 tension 54    0     0      3 H:18, L:18, M:18
bivariate()
## to perform bivariate analysis between 'Species' and 'Sepal.Length' in the iris dataset

bivariate(iris,'Species','Sepal.Length')

## bin_Sepal.Length = 'Sepal.Length' variable has been binned into 4 equal intervals (original range is [4.3,7.9])
## for each interval of 'Sepal.Length', the number of samples from each category of 'Species' is shown
## i.e. 39 of the 50 samples of Setosa have Sepal.Length is in the range (4.3,5.2], and so on.
## the number of intervals (4 in this case) can be customized (see documentation)
Output
> bivariate(iris,'Species','Sepal.Length')

   bin_Sepal.Length setosa versicolor virginica
 1        (4.3,5.2]     39          5         1
 2        (5.2,6.1]     11         29        10
 3          (6.1,7]      0         16        27
 4          (7,7.9]      0          0        12
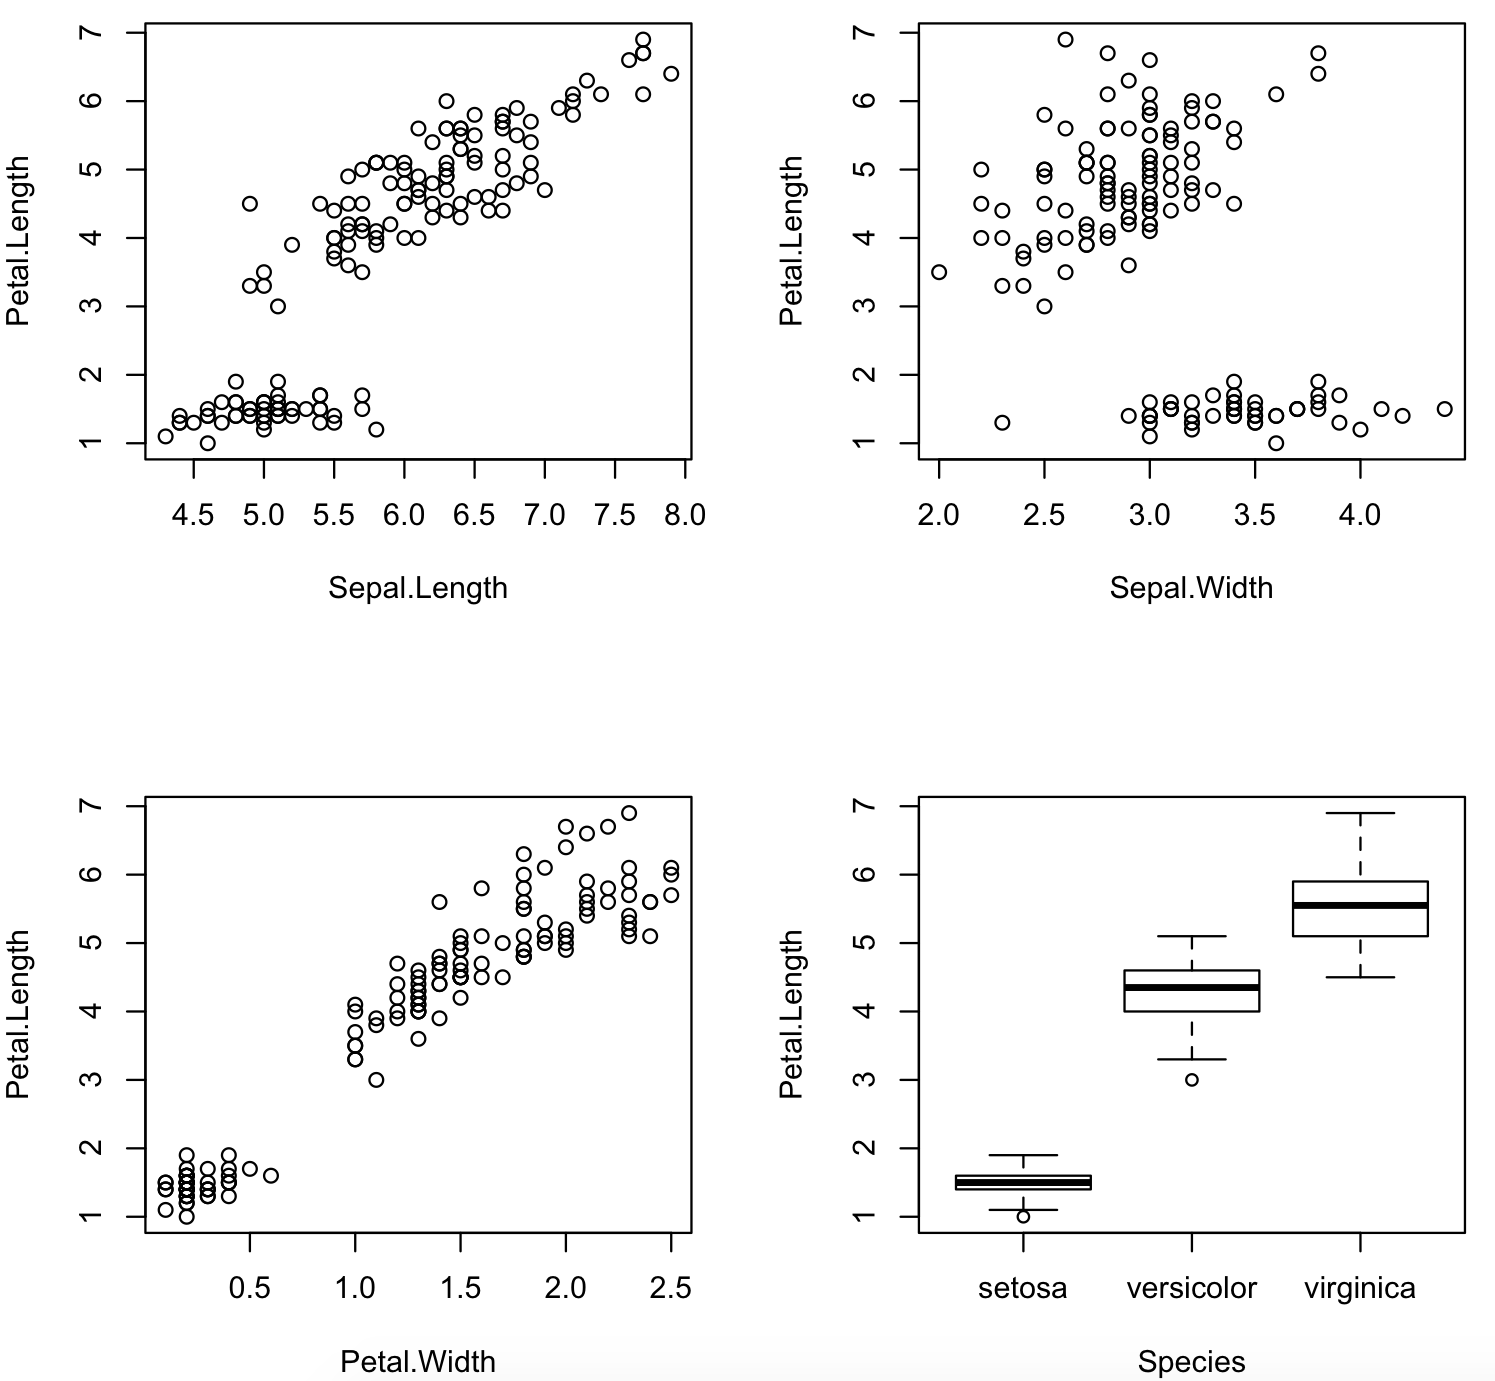
Plot()
## to plot all other variables against the 'Petal.Length' variable in the iris dataset

Plot(iris,'Petal.Length')

## some interesting patterns can be seen in the plots below and these insights can be used for predictive modeling
Output
> Plot(iris,'Petal.Length')

