All Projects → business-science → Anomalize

business-science / Anomalize

Tidy anomaly detection

Programming Languages

r
7636 projects

Projects that are alternatives of or similar to Anomalize

Pyodds
An End-to-end Outlier Detection System
Stars: ✭ 141 (-46.39%)
Mutual labels:  time-series, anomaly-detection
Taganomaly
Anomaly detection analysis and labeling tool, specifically for multiple time series (one time series per category)
Stars: ✭ 200 (-23.95%)
Mutual labels:  time-series, anomaly-detection
Matrixprofile
A Python 3 library making time series data mining tasks, utilizing matrix profile algorithms, accessible to everyone.
Stars: ✭ 141 (-46.39%)
Mutual labels:  time-series, anomaly-detection
Rnn Time Series Anomaly Detection
RNN based Time-series Anomaly detector model implemented in Pytorch.
Stars: ✭ 718 (+173%)
Mutual labels:  time-series, anomaly-detection
mvts-ano-eval
A repository for code accompanying the manuscript 'An Evaluation of Anomaly Detection and Diagnosis in Multivariate Time Series' (published at TNNLS)
Stars: ✭ 26 (-90.11%)
Mutual labels:  time-series, anomaly-detection
Getting Things Done With Pytorch
Jupyter Notebook tutorials on solving real-world problems with Machine Learning & Deep Learning using PyTorch. Topics: Face detection with Detectron 2, Time Series anomaly detection with LSTM Autoencoders, Object Detection with YOLO v5, Build your first Neural Network, Time Series forecasting for Coronavirus daily cases, Sentiment Analysis with BERT.
Stars: ✭ 738 (+180.61%)
Mutual labels:  time-series, anomaly-detection
Lstm anomaly thesis
Anomaly detection for temporal data using LSTMs
Stars: ✭ 178 (-32.32%)
Mutual labels:  time-series, anomaly-detection
Deepadots
Repository of the paper "A Systematic Evaluation of Deep Anomaly Detection Methods for Time Series".
Stars: ✭ 335 (+27.38%)
Mutual labels:  time-series, anomaly-detection
awesome-time-series
Resources for working with time series and sequence data
Stars: ✭ 178 (-32.32%)
Mutual labels:  time-series, anomaly-detection
singular-spectrum-transformation
fast implementation of singular spectrum transformation (change point detection algorithm)
Stars: ✭ 41 (-84.41%)
Mutual labels:  time-series, anomaly-detection
Ad examples
A collection of anomaly detection methods (iid/point-based, graph and time series) including active learning for anomaly detection/discovery, bayesian rule-mining, description for diversity/explanation/interpretability. Analysis of incorporating label feedback with ensemble and tree-based detectors. Includes adversarial attacks with Graph Convolutional Network.
Stars: ✭ 641 (+143.73%)
Mutual labels:  time-series, anomaly-detection
khiva-ruby
High-performance time series algorithms for Ruby
Stars: ✭ 27 (-89.73%)
Mutual labels:  time-series, anomaly-detection
Adtk
A Python toolkit for rule-based/unsupervised anomaly detection in time series
Stars: ✭ 615 (+133.84%)
Mutual labels:  time-series, anomaly-detection
Awesome Ts Anomaly Detection
List of tools & datasets for anomaly detection on time-series data.
Stars: ✭ 2,027 (+670.72%)
Mutual labels:  time-series, anomaly-detection
Telemanom
A framework for using LSTMs to detect anomalies in multivariate time series data. Includes spacecraft anomaly data and experiments from the Mars Science Laboratory and SMAP missions.
Stars: ✭ 589 (+123.95%)
Mutual labels:  time-series, anomaly-detection
Adaptive Alerting
Anomaly detection for streaming time series, featuring automated model selection.
Stars: ✭ 152 (-42.21%)
Mutual labels:  time-series, anomaly-detection
Pycaret
An open-source, low-code machine learning library in Python
Stars: ✭ 4,594 (+1646.77%)
Mutual labels:  time-series, anomaly-detection
Luminaire
Luminaire is a python package that provides ML driven solutions for monitoring time series data.
Stars: ✭ 316 (+20.15%)
Mutual labels:  time-series, anomaly-detection
msda
Library for multi-dimensional, multi-sensor, uni/multivariate time series data analysis, unsupervised feature selection, unsupervised deep anomaly detection, and prototype of explainable AI for anomaly detector
Stars: ✭ 80 (-69.58%)
Mutual labels:  time-series, anomaly-detection
mtad-gat-pytorch
PyTorch implementation of MTAD-GAT (Multivariate Time-Series Anomaly Detection via Graph Attention Networks) by Zhao et. al (2020, https://arxiv.org/abs/2009.02040).
Stars: ✭ 85 (-67.68%)
Mutual labels:  time-series, anomaly-detection

anomalize

Travis build status Coverage status CRAN_Status_Badge

Tidy anomaly detection

anomalize enables a tidy workflow for detecting anomalies in data. The main functions are time_decompose(), anomalize(), and time_recompose(). When combined, it’s quite simple to decompose time series, detect anomalies, and create bands separating the “normal” data from the anomalous data.

Anomalize In 2 Minutes (YouTube)

Anomalize

Check out our entire Software Intro Series on YouTube!

Installation

You can install the development version with devtools or the most recent CRAN version with install.packages():

# devtools::install_github("business-science/anomalize")
install.packages("anomalize")

How It Works

anomalize has three main functions:

  • time_decompose(): Separates the time series into seasonal, trend, and remainder components
  • anomalize(): Applies anomaly detection methods to the remainder component.
  • time_recompose(): Calculates limits that separate the “normal” data from the anomalies!

Getting Started

Load the tidyverse and anomalize packages.

library(tidyverse)
library(anomalize)

Next, let’s get some data. anomalize ships with a data set called tidyverse_cran_downloads that contains the daily CRAN download counts for 15 “tidy” packages from 2017-01-01 to 2018-03-01.

Suppose we want to determine which daily download “counts” are anomalous. It’s as easy as using the three main functions (time_decompose(), anomalize(), and time_recompose()) along with a visualization function, plot_anomalies().

tidyverse_cran_downloads %>%
    # Data Manipulation / Anomaly Detection
    time_decompose(count, method = "stl") %>%
    anomalize(remainder, method = "iqr") %>%
    time_recompose() %>%
    # Anomaly Visualization
    plot_anomalies(time_recomposed = TRUE, ncol = 3, alpha_dots = 0.25) +
    labs(title = "Tidyverse Anomalies", subtitle = "STL + IQR Methods") 
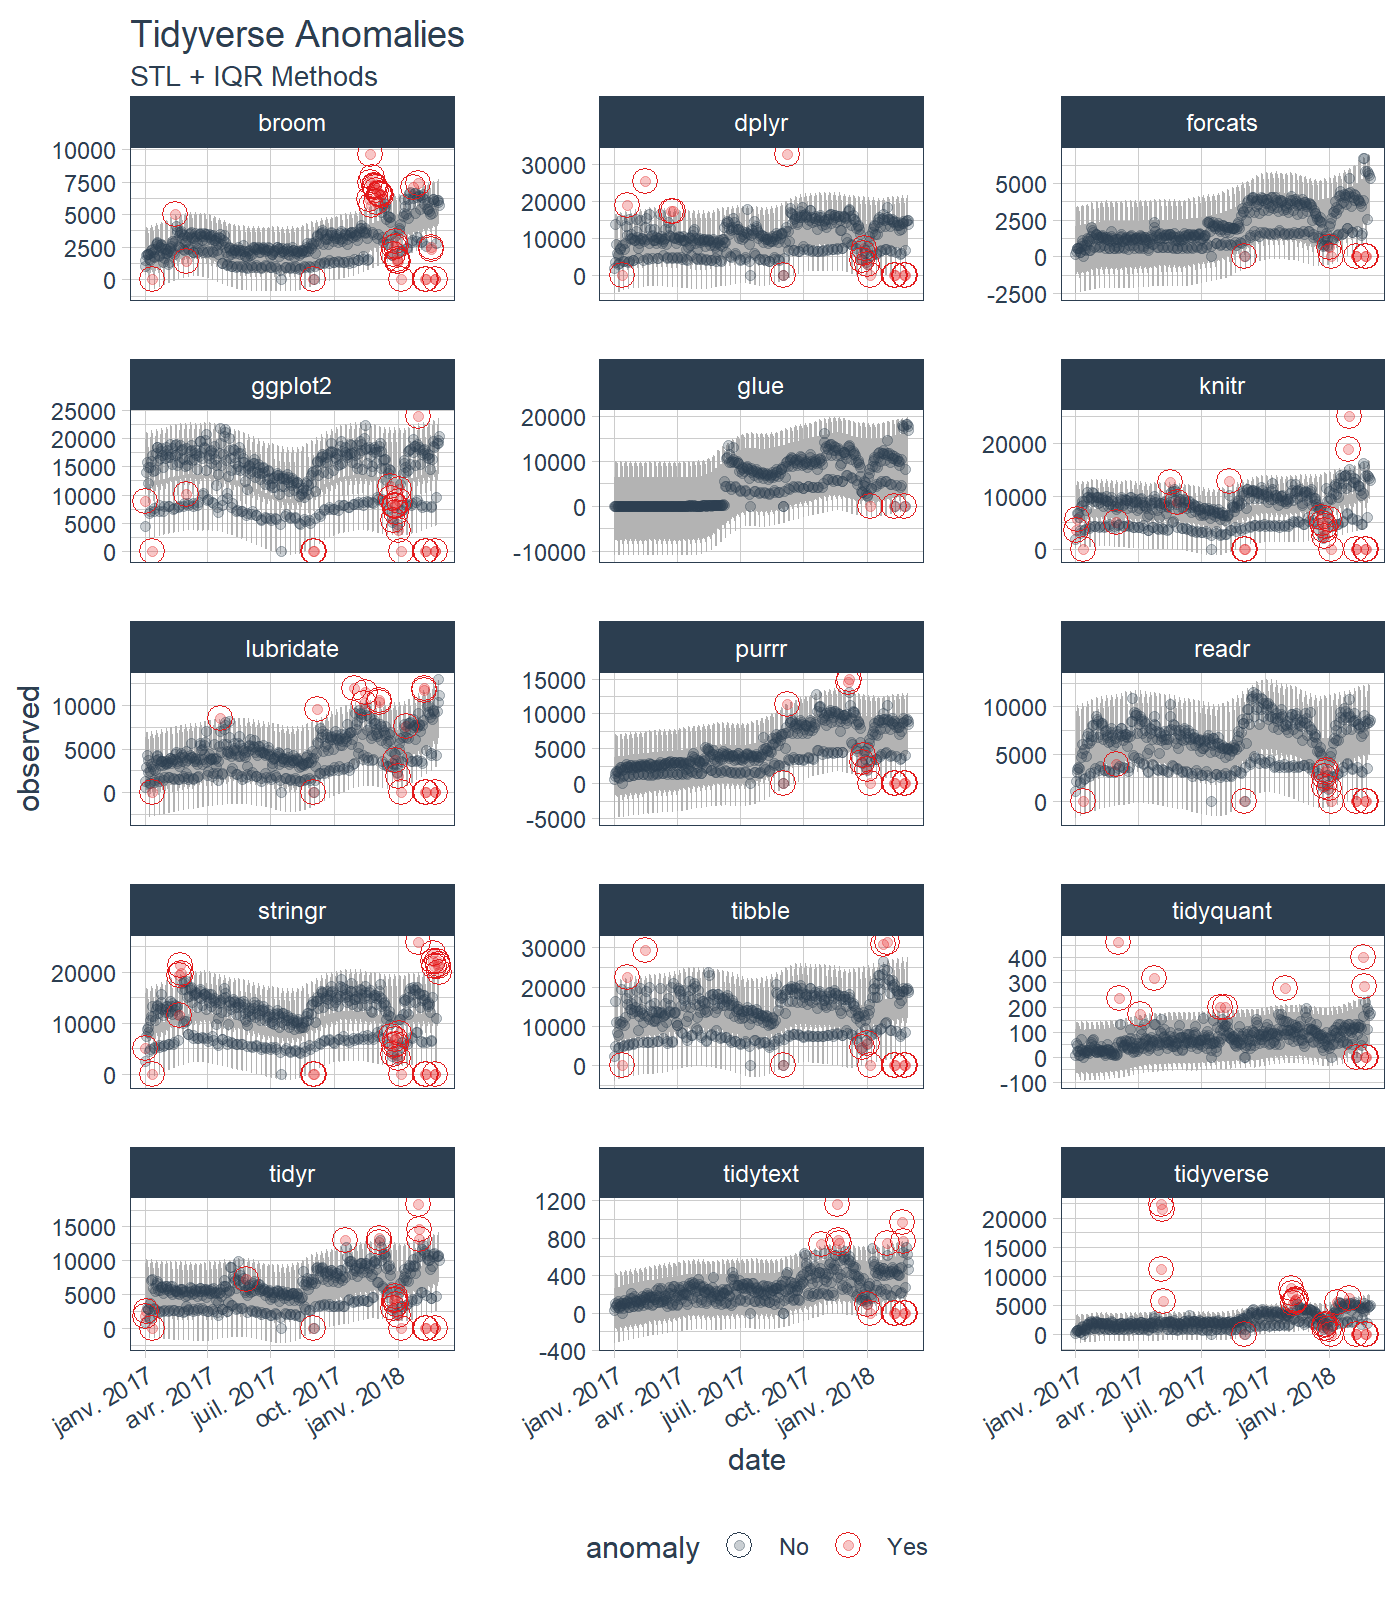
Check out the anomalize Quick Start Guide.

Reducing Forecast Error by 32%

Yes! Anomalize has a new function, clean_anomalies(), that can be used to repair time series prior to forecasting. We have a brand new vignette - Reduce Forecast Error (by 32%) with Cleaned Anomalies.

tidyverse_cran_downloads %>%
    filter(package == "lubridate") %>%
    ungroup() %>%
    time_decompose(count) %>%
    anomalize(remainder) %>%
  
    # New function that cleans & repairs anomalies!
    clean_anomalies() %>%
  
    select(date, anomaly, observed, observed_cleaned) %>%
    filter(anomaly == "Yes")
#> # A time tibble: 19 x 4
#> # Index: date
#>    date       anomaly  observed observed_cleaned
#>    <date>     <chr>       <dbl>            <dbl>
#>  1 2017-01-12 Yes     -1.14e-13            3522.
#>  2 2017-04-19 Yes      8.55e+ 3            5202.
#>  3 2017-09-01 Yes      3.98e-13            4137.
#>  4 2017-09-07 Yes      9.49e+ 3            4871.
#>  5 2017-10-30 Yes      1.20e+ 4            6413.
#>  6 2017-11-13 Yes      1.03e+ 4            6641.
#>  7 2017-11-14 Yes      1.15e+ 4            7250.
#>  8 2017-12-04 Yes      1.03e+ 4            6519.
#>  9 2017-12-05 Yes      1.06e+ 4            7099.
#> 10 2017-12-27 Yes      3.69e+ 3            7073.
#> 11 2018-01-01 Yes      1.87e+ 3            6418.
#> 12 2018-01-05 Yes     -5.68e-14            6293.
#> 13 2018-01-13 Yes      7.64e+ 3            4141.
#> 14 2018-02-07 Yes      1.19e+ 4            8539.
#> 15 2018-02-08 Yes      1.17e+ 4            8237.
#> 16 2018-02-09 Yes     -5.68e-14            7780.
#> 17 2018-02-10 Yes      0.                  5478.
#> 18 2018-02-23 Yes     -5.68e-14            8519.
#> 19 2018-02-24 Yes      0.                  6218.

But Wait, There’s More!

There are a several extra capabilities:

  • plot_anomaly_decomposition() for visualizing the inner workings of how algorithm detects anomalies in the “remainder”.
tidyverse_cran_downloads %>%
    filter(package == "lubridate") %>%
    ungroup() %>%
    time_decompose(count) %>%
    anomalize(remainder) %>%
    plot_anomaly_decomposition() +
    labs(title = "Decomposition of Anomalized Lubridate Downloads")

For more information on the anomalize methods and the inner workings, please see “Anomalize Methods” Vignette.

References

Several other packages were instrumental in developing anomaly detection methods used in anomalize:

  • Twitter’s AnomalyDetection, which implements decomposition using median spans and the Generalized Extreme Studentized Deviation (GESD) test for anomalies.
  • forecast::tsoutliers() function, which implements the IQR method.

Interested in Learning Anomaly Detection?

Business Science offers two 1-hour courses on Anomaly Detection:

Note that the project description data, including the texts, logos, images, and/or trademarks, for each open source project belongs to its rightful owner. If you wish to add or remove any projects, please contact us at [email protected].