All Projects → karoliskoncevicius → Basetheme

karoliskoncevicius / Basetheme

Themes for base plotting system in R

Programming Languages

r
7636 projects

Projects that are alternatives of or similar to Basetheme

Lets Plot Kotlin
Kotlin API for Lets-Plot - an open-source plotting library for statistical data.
Stars: ✭ 181 (+82.83%)
Mutual labels:  graphics, plot
Aachartkit Swift
📈📊📱💻🖥️An elegant modern declarative data visualization chart framework for iOS, iPadOS and macOS. Extremely powerful, supports line, spline, area, areaspline, column, bar, pie, scatter, angular gauges, arearange, areasplinerange, columnrange, bubble, box plot, error bars, funnel, waterfall and polar chart types. 极其精美而又强大的跨平台数据可视化图表框架,支持柱状图、条形图、…
Stars: ✭ 1,962 (+1881.82%)
Mutual labels:  graphics, plot
G2plot
🍡 An interactive and responsive charting library
Stars: ✭ 2,072 (+1992.93%)
Mutual labels:  graphics, plot
Aachartcore Kotlin
📈📊⛰⛰⛰An elegant modern declarative data visualization chart framework for Android . Extremely powerful, supports line, spline, area, areaspline, column, bar, pie, scatter, angular gauges, arearange, areasplinerange, columnrange, bubble, box plot, error bars, funnel, waterfall and polar chart types.极其精美而又强大的 Android 数据可视化图表框架,支持柱状图、条形图、折线图、曲线图、折线填充图、曲线填充图、气泡图、扇形图、环形图、散点图、雷达图、混合图等各种类型的多达几十种的信息图图表,完全满足工作所需.
Stars: ✭ 332 (+235.35%)
Mutual labels:  graphics, plot
Gpac
Modular Multimedia framework for packaging, streaming and playing your favorite content.
Stars: ✭ 1,321 (+1234.34%)
Mutual labels:  graphics
Plexus
Polygonal mesh processing.
Stars: ✭ 90 (-9.09%)
Mutual labels:  graphics
Plotters
A rust drawing library for high quality data plotting for both WASM and native, statically and realtimely 🦀 📈🚀
Stars: ✭ 1,287 (+1200%)
Mutual labels:  plot
Shoebot
Easy vector graphics with Python
Stars: ✭ 88 (-11.11%)
Mutual labels:  graphics
Highcharts Chart
Polymer Element wrapper for highcharts library. Seamlessly create various types of charts from one element.
Stars: ✭ 97 (-2.02%)
Mutual labels:  plot
Smo Shaders
A collection of shaders to replicate those used in Super Mario Odyssey's Snapshot Mode.
Stars: ✭ 97 (-2.02%)
Mutual labels:  graphics
Colourlovers
🎨 📦 R Client for the COLOURlovers API
Stars: ✭ 92 (-7.07%)
Mutual labels:  graphics
C3
📊 A D3-based reusable chart library
Stars: ✭ 9,163 (+9155.56%)
Mutual labels:  graphics
Ggplotnim
A port of ggplot2 for Nim
Stars: ✭ 95 (-4.04%)
Mutual labels:  plot
Ol3d
A tiny portable 3D graphics lib for micro controllers
Stars: ✭ 90 (-9.09%)
Mutual labels:  graphics
Wesanderson
A Wes Anderson color palette for R
Stars: ✭ 1,343 (+1256.57%)
Mutual labels:  plot
3dhop
3D Heritage Online Presenter
Stars: ✭ 89 (-10.1%)
Mutual labels:  graphics
Gpu Planetary Rendering
GPU atmosphertic scattering and planet generation in Unity 3D
Stars: ✭ 92 (-7.07%)
Mutual labels:  graphics
Minecraft Hack Baseclient
This is a Minecraft Base Client
Stars: ✭ 95 (-4.04%)
Mutual labels:  base
Godot Hair Shader
My attempt at a hair shader in Godot
Stars: ✭ 91 (-8.08%)
Mutual labels:  graphics
Hlslexplorer
See how hardware understands your HLSL
Stars: ✭ 91 (-8.08%)
Mutual labels:  graphics

CRAN version dependencies Monthly Downloads

basetheme

R package implementing a theming system for base plotting.

Description

The basetheme() function provides a persistent way to set and unset R plotting settings. All the user has to do is set the theme once and it will be consistently applied to all the subsequent plots even after the graphics device is closed. The function only works with base graphics system, so if you are exclusively working with ggplot2, boy, did you install the wrong package.

Usage

The persistent settings are controlled via the basetheme() function. To an extent this function mimics the behaviour and arguments of par() and has multiple modes of operation:

# Specifying the `par()` values directly:
basetheme(pch=19, mgp=c(2,.7,0), tck=-.01)

# Choosing a theme by name:
basetheme("clean")

# Using a mix of the above:
basetheme("minimal", bg="grey", pch=1)

# Specifying a list with theme values:
theme <- basetheme("clean")
theme$cex.main <- 2
basetheme(theme)

# Obtaining a list of parameters for the current theme:
basetheme()

# Removing the current theme:
basetheme(NULL)

In addition to basetheme() two additional functions are provided for colors manipulation within the plots: num2col() and lab2col(). See documentation: help(basetheme), help(num2col), help(lab2col) and examples: example(basetheme), example(num2col), example(lab2col) for more details.

Some Examples

A few examples using of how it all works together.

basetheme("void")
boxplot(split(iris$Sepal.Width, iris$Species))

basetheme("clean")
barplot(rivers, col=num2col(rivers))

basetheme("brutal")
plot(hclust(dist(USArrests), "ward.D2"), hang=-1)
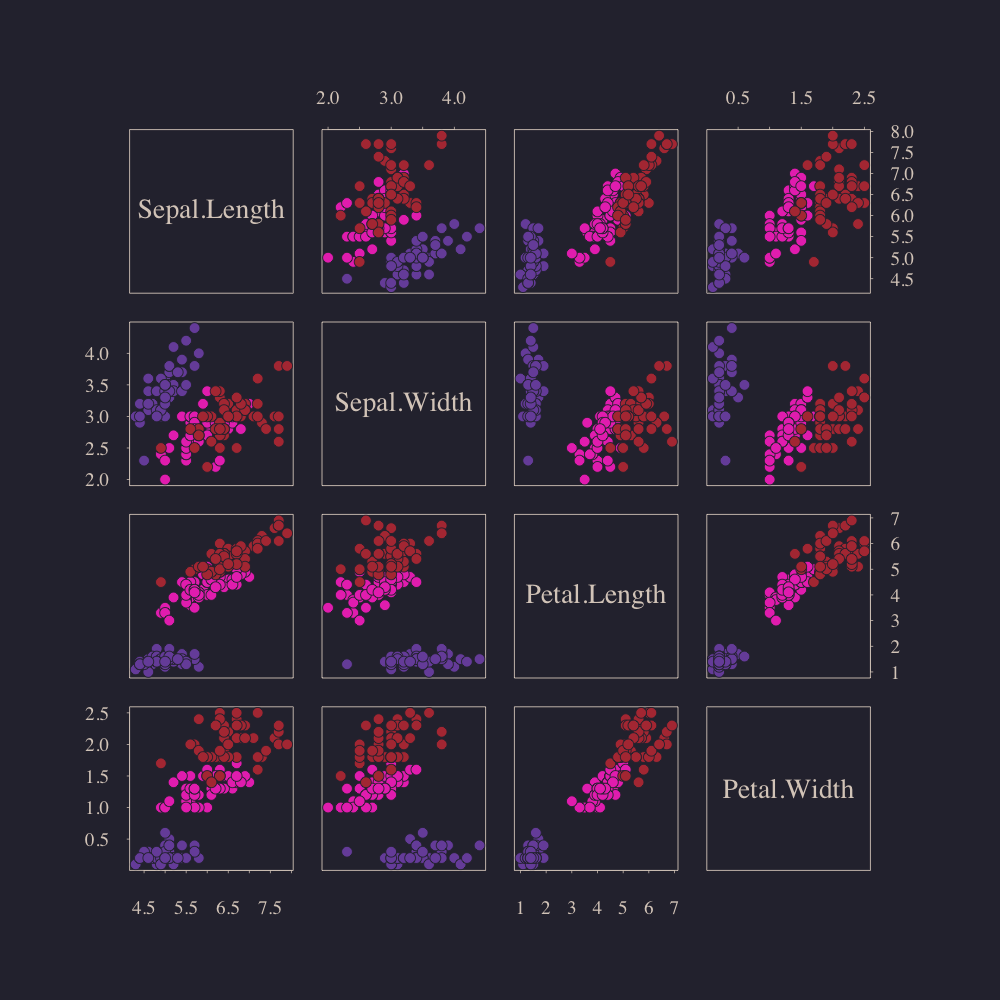
basetheme("royal")
pairs(iris[-5], bg=lab2col(iris$Species), col=0)

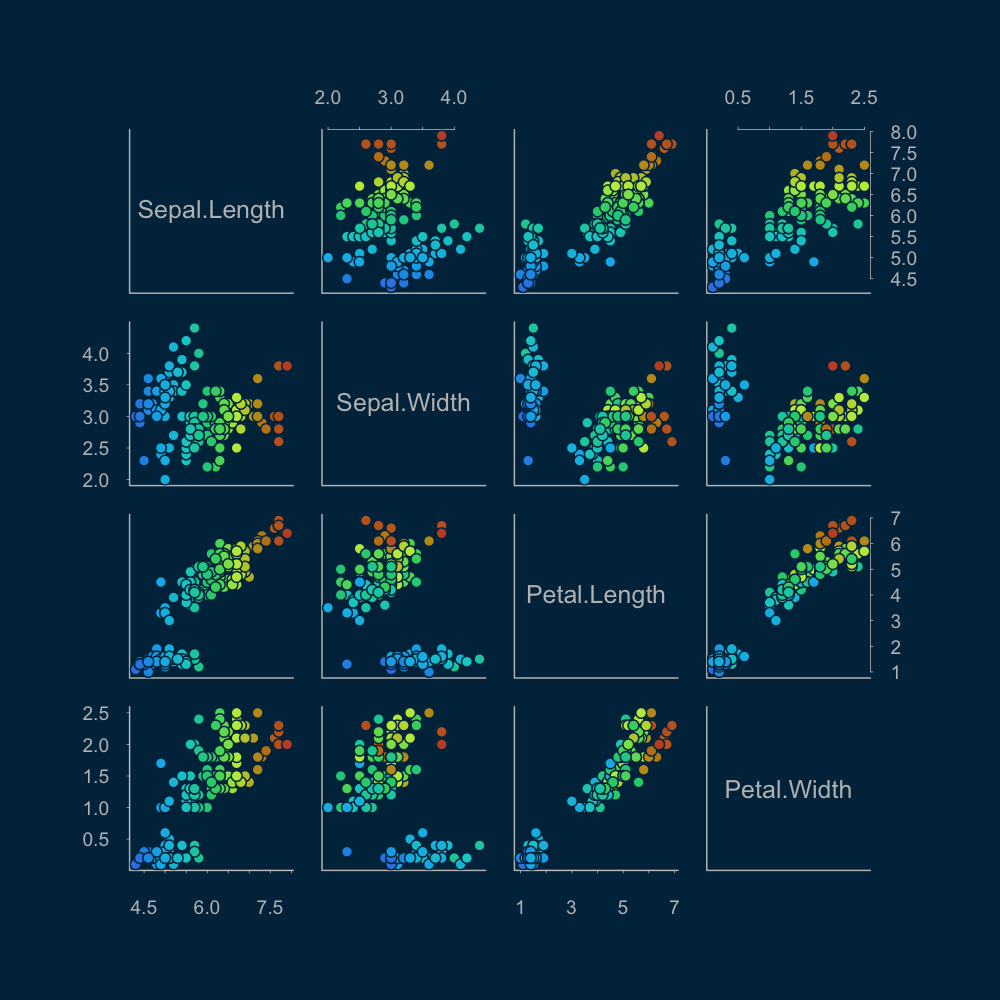
basetheme("deepblue")
pairs(iris[-5], bg=num2col(iris[,1]), col=0)

x <- seq(-1.95, 1.95, length = 30)
y <- seq(-1.95, 1.95, length = 35)
z <- outer(x, y, function(a, b) a*b^2)

basetheme("dark")
persp(x, y, z, theta=-45)

More Details

Additional details can be found in the Wiki pages:

  1. List of Available Themes
  2. Creating Custom Themes
  3. Installation Instructions
  4. Implementation Details

See Also

CRAN:

  1. prettyB

GitHub:

  1. styles
Note that the project description data, including the texts, logos, images, and/or trademarks, for each open source project belongs to its rightful owner. If you wish to add or remove any projects, please contact us at [email protected].