karthik / Wesanderson
Licence: other
A Wes Anderson color palette for R
Stars: ✭ 1,343
Programming Languages
r
7636 projects
Projects that are alternatives of or similar to Wesanderson
Aachartkit Swift
📈📊📱💻🖥️An elegant modern declarative data visualization chart framework for iOS, iPadOS and macOS. Extremely powerful, supports line, spline, area, areaspline, column, bar, pie, scatter, angular gauges, arearange, areasplinerange, columnrange, bubble, box plot, error bars, funnel, waterfall and polar chart types. 极其精美而又强大的跨平台数据可视化图表框架,支持柱状图、条形图、…
Stars: ✭ 1,962 (+46.09%)
Mutual labels: data-visualization, plot
Covid19 Dashboard
🦠 Django + Plotly Coronavirus dashboard. Powerful data driven Python web-app, with an awesome UI. Contributions welcomed! Featured on 🕶Awesome-list
Stars: ✭ 100 (-92.55%)
Mutual labels: data-visualization, plot
Vapeplot
matplotlib extension for vaporwave aesthetics
Stars: ✭ 483 (-64.04%)
Mutual labels: plot, color-palette
Uplot
📈 A small, fast chart for time series, lines, areas, ohlc & bars
Stars: ✭ 6,808 (+406.92%)
Mutual labels: data-visualization, plot
Harrypotter
🎨 Harry Potter inspired palette for R
Stars: ✭ 66 (-95.09%)
Mutual labels: plot, color-palette
gameofthrones
🎨 Game of Thrones inspired palette for R
Stars: ✭ 69 (-94.86%)
Mutual labels: plot, color-palette
Lets Plot
An open-source plotting library for statistical data.
Stars: ✭ 531 (-60.46%)
Mutual labels: data-visualization, plot
Gramm
Gramm is a complete data visualization toolbox for Matlab. It provides an easy to use and high-level interface to produce publication-quality plots of complex data with varied statistical visualizations. Gramm is inspired by R's ggplot2 library.
Stars: ✭ 541 (-59.72%)
Mutual labels: data-visualization, plot
Scottplot
Interactive Plotting Library for .NET
Stars: ✭ 736 (-45.2%)
Mutual labels: data-visualization, plot
Colors App
🎨 A PWA for copying values from popular color palettes. Supports HEX, RGB, and HSL formats.
Stars: ✭ 90 (-93.3%)
Mutual labels: color-palette
Itermplot
An awesome iTerm2 backend for Matplotlib, so you can plot directly in your terminal.
Stars: ✭ 1,267 (-5.66%)
Mutual labels: plot
Gvcci
color extraction to turn images into 16 color palettes
Stars: ✭ 86 (-93.6%)
Mutual labels: color-palette
Aethos
Automated Data Science and Machine Learning library to optimize workflow.
Stars: ✭ 94 (-93%)
Mutual labels: data-visualization
Plotters
A rust drawing library for high quality data plotting for both WASM and native, statically and realtimely 🦀 📈🚀
Stars: ✭ 1,287 (-4.17%)
Mutual labels: plot
Codecharta
CodeCharta visualizes multiple code metrics using 3D tree maps.
Stars: ✭ 85 (-93.67%)
Mutual labels: data-visualization
Three Forcegraph
Force-directed graph as a ThreeJS 3d object
Stars: ✭ 84 (-93.75%)
Mutual labels: data-visualization
Wes Anderson Palettes
I saved you from boring plots. What did you ever do? - Max Fischer (probably)
Tired of generic mass produced palettes for your plots? Short of adding an owl and dressing up your plot in a bowler hat, here’s the most indie thing you can do to one. First round of palettes derived from the amazing Tumblr blog Wes Anderson Palettes.
Installation
install.packages("wesanderson")
Or the development version
devtools::install_github("karthik/wesanderson")
Usage
library("wesanderson")

# See all palettes
names(wes_palettes)
#>  [1] "BottleRocket1"  "BottleRocket2"  "Rushmore1"      "Rushmore"
#>  [5] "Royal1"         "Royal2"         "Zissou1"        "Darjeeling1"
#>  [9] "Darjeeling2"    "Chevalier1"     "FantasticFox1"  "Moonrise1"
#> [13] "Moonrise2"      "Moonrise3"      "Cavalcanti1"    "GrandBudapest1"
#> [17] "GrandBudapest2" "IsleofDogs1"    "IsleofDogs2"
Palettes
Bottle Rocket (1996)
wes_palette("BottleRocket1")
wes_palette("BottleRocket2")
Rushmore (1998)
wes_palette("Rushmore1")
The Royal Tenenbaums (2001)
wes_palette("Royal1")
wes_palette("Royal2")
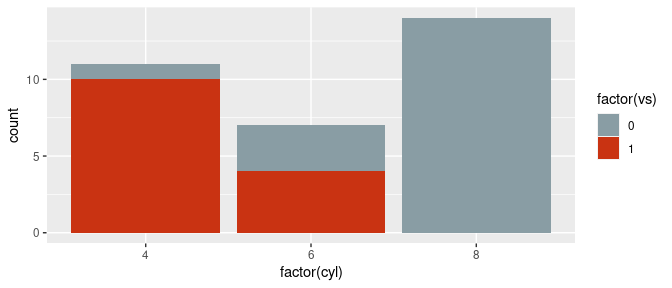
library("ggplot2")
ggplot(mtcars, aes(factor(cyl), fill=factor(vs))) +  geom_bar() +
  scale_fill_manual(values = wes_palette("Royal1"))
The Life Aquatic with Steve Zissou (2004)
wes_palette("Zissou1")
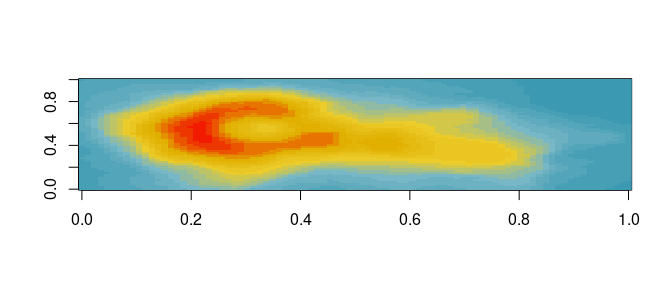
pal <- wes_palette("Zissou1", 21, type = "continuous")
image(volcano, col = pal)
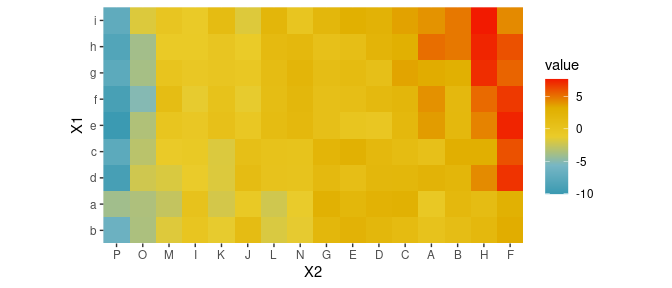
pal <- wes_palette("Zissou1", 100, type = "continuous")
# heatmap is a local dataset
ggplot(heatmap, aes(x = X2, y = X1, fill = value)) +
  geom_tile() +
  scale_fill_gradientn(colours = pal) +
  scale_x_discrete(expand = c(0, 0)) +
  scale_y_discrete(expand = c(0, 0)) +
  coord_equal()
The Darjeeling Limited (2007)
wes_palette("Darjeeling1")
wes_palette("Darjeeling2")
Hotel Chevalier (2007)
wes_palette("Chevalier1")
Fantastic Mr. Fox (2009)
wes_palette("FantasticFox1")
Moonrise Kingdom (2012)
wes_palette("Moonrise1")
wes_palette("Moonrise2")
wes_palette("Moonrise3")
Castello Cavalcanti (2013)
wes_palette("Cavalcanti1")
The Grand Budapest Hotel (2014)
wes_palette("GrandBudapest1")
wes_palette("GrandBudapest2")
The Isle of Dogs (2018)
wes_palette("IsleofDogs1")
wes_palette("IsleofDogs2")
As seen in these publications
- The environmental niche of the global high seas pelagic longline fleet Science Advances 08 Aug 2018
Note that the project description data, including the texts, logos, images, and/or trademarks,
for each open source project belongs to its rightful owner.
If you wish to add or remove any projects, please contact us at [email protected].


