Cabot


Maintainers wanted
Cabot is stable and used by hundreds of companies and individuals in production, but it is not actively maintained. We would like to hand over maintenance of the project to one or more responsible and experienced maintainers. Please email [email protected] with some information about yourself (github profile and/or CV) if you are interested.
Why choose Cabot
Cabot is a free, open-source, self-hosted infrastructure monitoring platform that provides some of the best features of PagerDuty, Server Density, Pingdom and Nagios without their cost and complexity. (Nagios, I'm mainly looking at you.)
It provides a web interface that allows you to monitor services (e.g. "Stage Redis server", "Production ElasticSearch cluster") and send telephone, sms or hipchat/email alerts to your on-duty team if those services start misbehaving or go down - all without writing a line of code. Best of all, you can use data that you're already pushing to Graphite/statsd to generate alerts, rather than implementing and maintaining a whole new system of data collectors.
You can alert based on:
We built Cabot as a Christmas project at Arachnys because we couldn't wrap our heads around Nagios, and nothing else out there seemed to fit our use case. We're open-sourcing it in the hope that others find it useful.
Cabot is written in Python and uses Django, Bootstrap, Font Awesome and a whole host of other goodies under the hood.
Screenshots
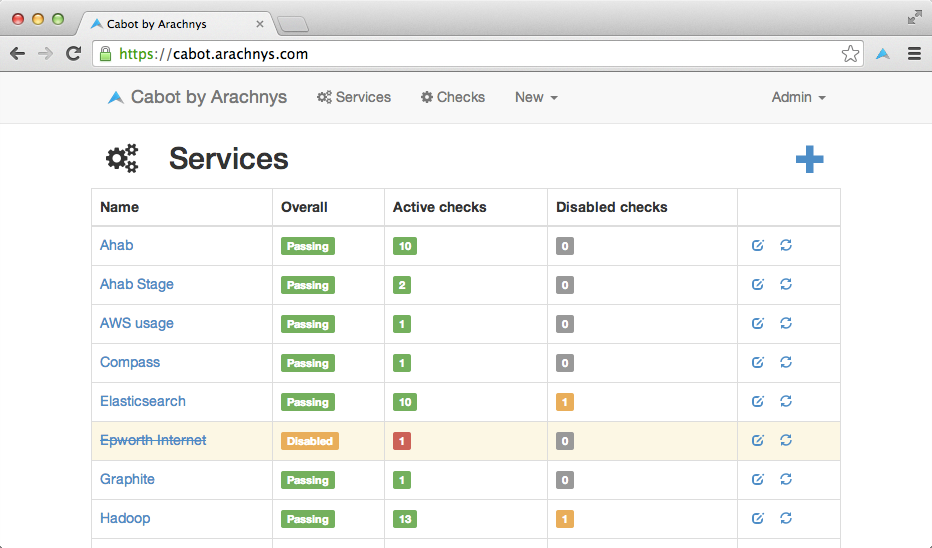
Services dashboard
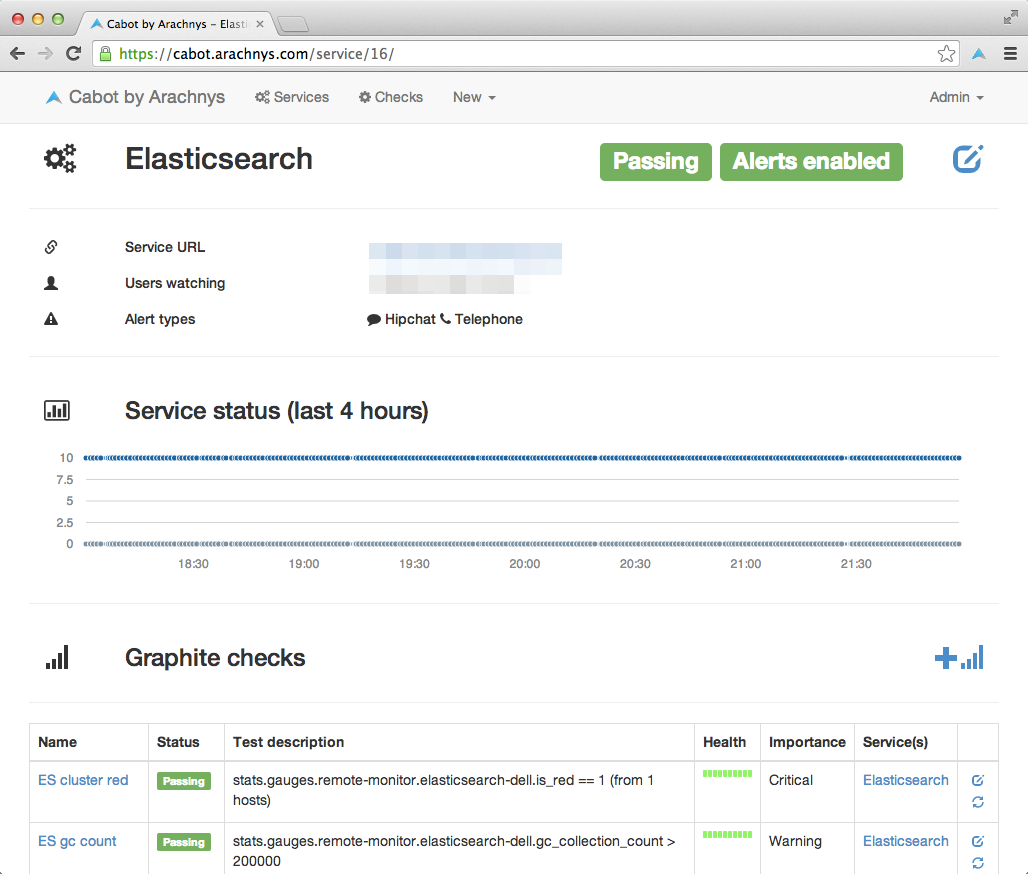
Single service overview
Quickstart
Using Docker: Deploy in 5 minutes or less using official quickstart guide at cabotapp.com. (See also https://hub.docker.com/r/cabotapp/cabot/)
How it works
Docs have moved to cabotapp.com
Sections:
For those who want to contribute:
FAQ
Why "Cabot"?
My dog is called Cabot and he loves monitoring things. Mainly the presence of food in his immediate surroundings, or perhaps the frequency of squirrel visits to our garden. He also barks loudly to alert us on certain events (e.g. the postman coming to the door).
It's just a lucky coincidence that his name sounds like he could be an automation tool.
API
The API has automatically generated documentation available by browsing https://cabot.yourcompany.com/api. The browsable documentation displays example GET requests and lists other allowed HTTP methods.
To view individual items, append the item id to the url. For example, to view graphite_check 1, browse:
/api/graphite_checks/1/
Authentication
The API allows HTTP basic auth using standard Django usernames and passwords as well as session authentication (by submitting the login form on the login page). The API similarly uses standard Django permissions to allow and deny API access.
All resources are GETable by any authenticated user, but individual permissions must be granted for POST, PUT, and other write methods.
As an example, for POST access to all status_check subclasses, add the following permissions:
cabotapp | status check | Can add graphite status check
cabotapp | status check | Can add http status check
cabotapp | status check | Can add icmp status check
cabotapp | status check | Can add jenkins status check
Access the Django admin page at https://cabot.yourcompany.com/admin to add/remove users, change user permissions, add/remove groups for group-based permission control, and change group permissions.
Sorting and Filtering
Sorting and filtering can be used by both REST clients and on the browsable API. All fields visible in the browsable API can be used for filtering and sorting.
Get all jenkins_checks with debounce enabled and CRITICAL importance:
https://cabot.yourcompany.com/api/jenkins_checks/?debounce=1&importance=CRITICAL
Sort graphite_checks by name field, ascending:
https://cabot.yourcompany.com/api/graphite_checks/?ordering=name
Sort by name field, descending:
https://cabot.yourcompany.com/api/graphite_checks/?ordering=-name
Other (non-Cabot specific) examples are available in the Django REST Framework documentation.
License
See LICENSE file in this repo.