ghtmtt / Dataplotly
Licence: gpl-2.0
D3 like plots creation with plotly in QGIS
Stars: ✭ 130
Programming Languages
python
139335 projects - #7 most used programming language
Projects that are alternatives of or similar to Dataplotly
Plotly Graphing Library For Matlab
Plotly Graphing Library for MATLAB®
Stars: ✭ 234 (+80%)
Mutual labels: plotly, d3js
V Chart Plugin
Easily bind a chart to the data stored in your Vue.js components.
Stars: ✭ 188 (+44.62%)
Mutual labels: datavisualization, d3js
Awesome D3
A list of D3 libraries, plugins and utilities
Stars: ✭ 4,779 (+3576.15%)
Mutual labels: datavisualization, d3js
leaflet heatmap
简单的可视化湖州通话数据 假设数据量很大,没法用浏览器直接绘制热力图,把绘制热力图这一步骤放到线下计算分析。使用Apache Spark并行计算数据之后,再使用Apache Spark绘制热力图,然后用leafletjs加载OpenStreetMap图层和热力图图层,以达到良好的交互效果。现在使用Apache Spark实现绘制,可能是Apache Spark不擅长这方面的计算或者是我没有设计好算法,并行计算的速度比不上单机计算。Apache Spark绘制热力图和计算代码在这 https://github.com/yuanzhaokang/ParallelizeHeatmap.git .
Stars: ✭ 13 (-90%)
Mutual labels: d3js, datavisualization
D3 Extended
Extends D3 with some common jQuery functions and more
Stars: ✭ 269 (+106.92%)
Mutual labels: datavisualization, d3js
Dex
Dex : The Data Explorer -- A data visualization tool written in Java/Groovy/JavaFX capable of powerful ETL and publishing web visualizations.
Stars: ✭ 1,238 (+852.31%)
Mutual labels: datavisualization, d3js
Giojs
🌏 A Declarative 3D Globe Data Visualization Library built with Three.js
Stars: ✭ 1,528 (+1075.38%)
Mutual labels: datavisualization
D3 Audio Spectrum
Spectrum analysis demo using D3 and HTML5 audio
Stars: ✭ 101 (-22.31%)
Mutual labels: d3js
D3graphtheory
💥 Interactive and colorful 🎨 graph theory tutorials made using d3.js ⚡️
Stars: ✭ 1,364 (+949.23%)
Mutual labels: d3js
Hiitpi
A workout trainer Dash/Flask app that helps track your HIIT workouts by analyzing real-time video streaming from your sweet Pi using machine learning and Edge TPU..
Stars: ✭ 106 (-18.46%)
Mutual labels: plotly
Particles
A particle simulation engine based on a port of d3-force
Stars: ✭ 104 (-20%)
Mutual labels: d3js
Covid19 Dashboard
🦠 Django + Plotly Coronavirus dashboard. Powerful data driven Python web-app, with an awesome UI. Contributions welcomed! Featured on 🕶Awesome-list
Stars: ✭ 100 (-23.08%)
Mutual labels: plotly
Collapsibletree
Create Interactive Collapsible Tree Diagrams in R using D3.js
Stars: ✭ 126 (-3.08%)
Mutual labels: d3js
D3 Org Tree
A highly customizable org tree built with d3.js v5
Stars: ✭ 109 (-16.15%)
Mutual labels: d3js
DataPlotly
The DataPlotly plugin allows creation of -like
interactive plots directly within QGIS, thanks to the
library and its Python API.
DataPlotly makes plot creation and customization easy for every needs.
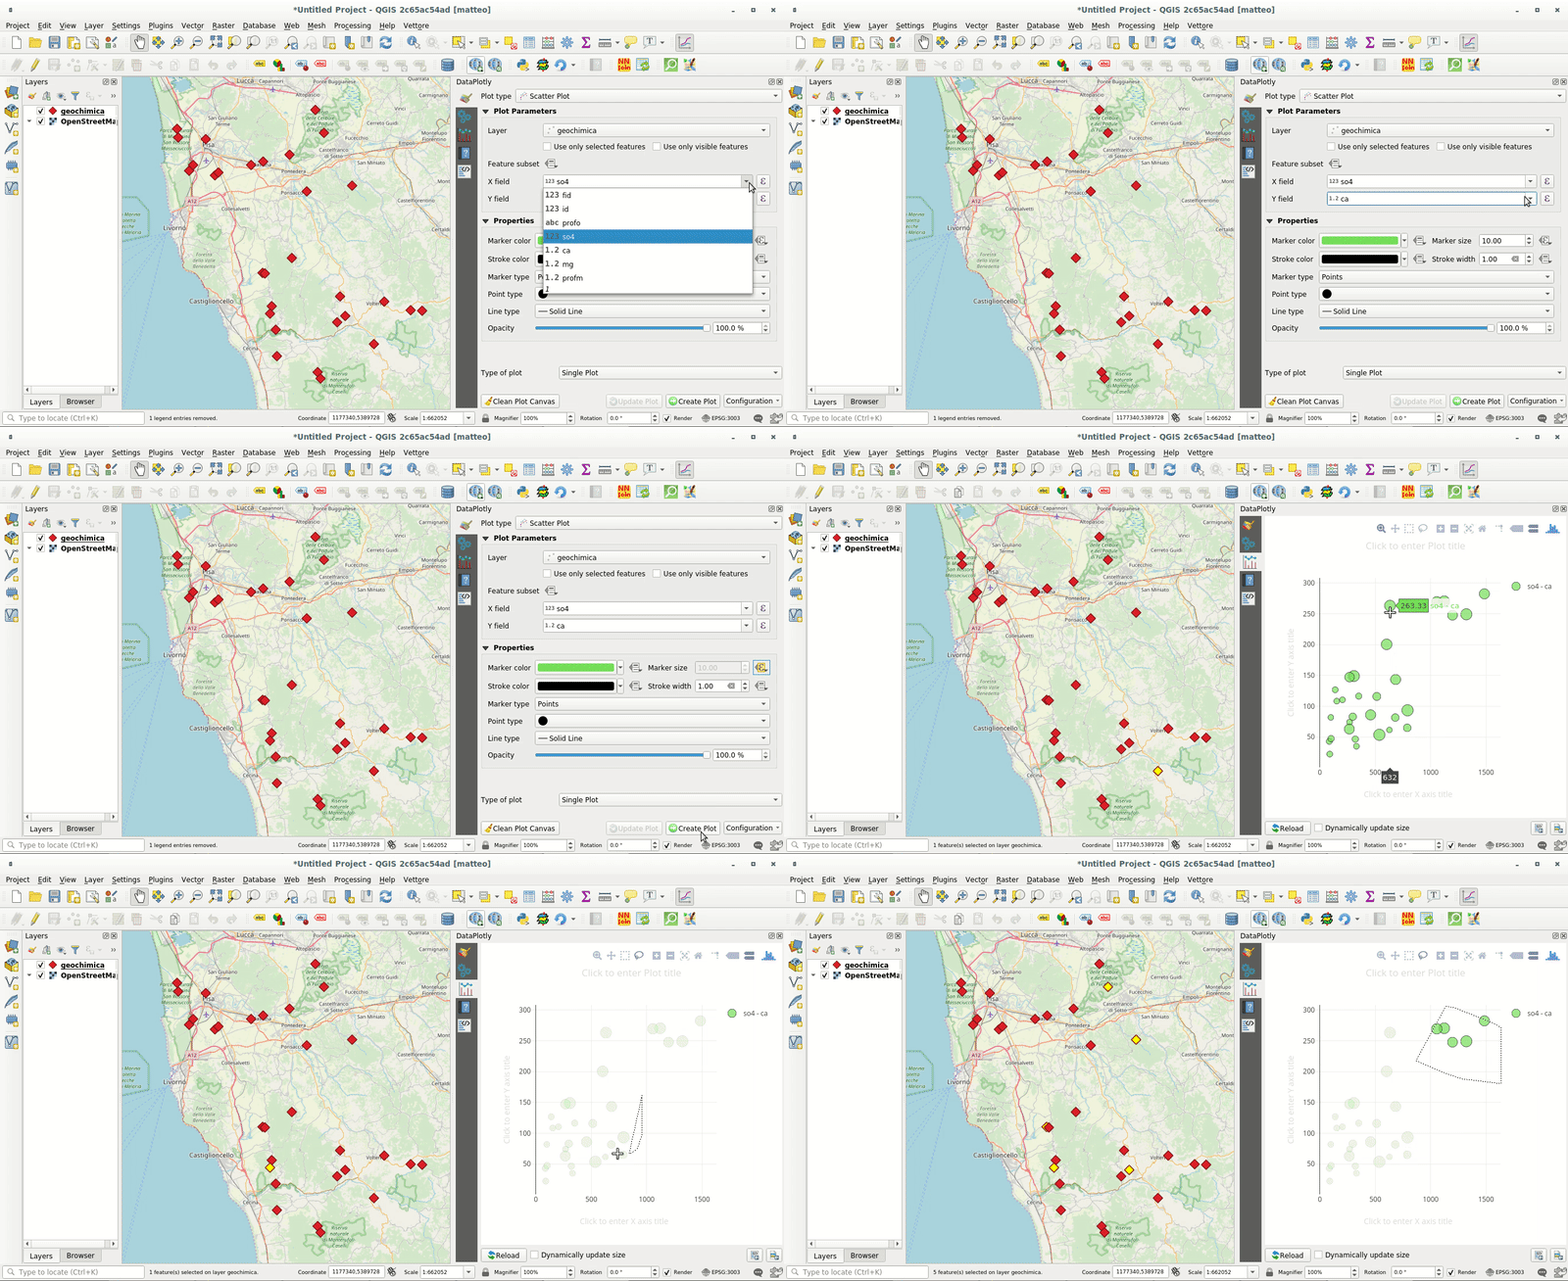
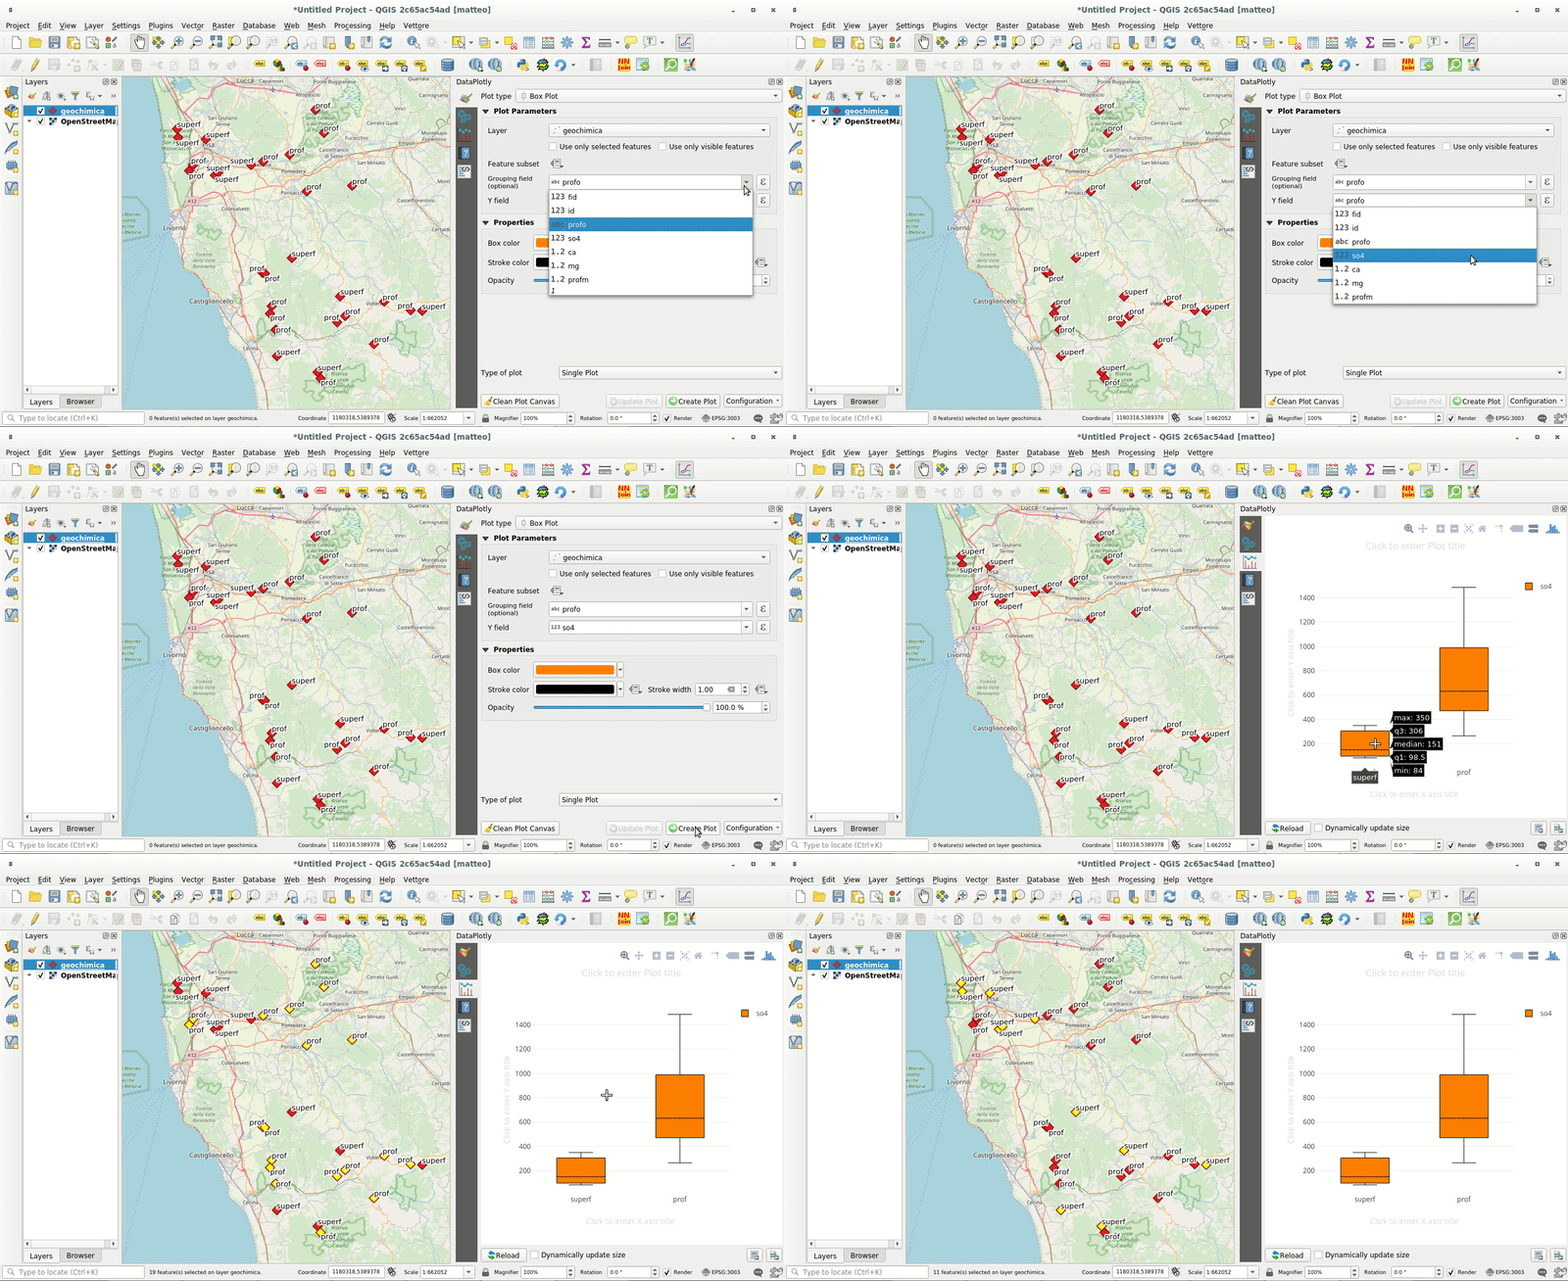
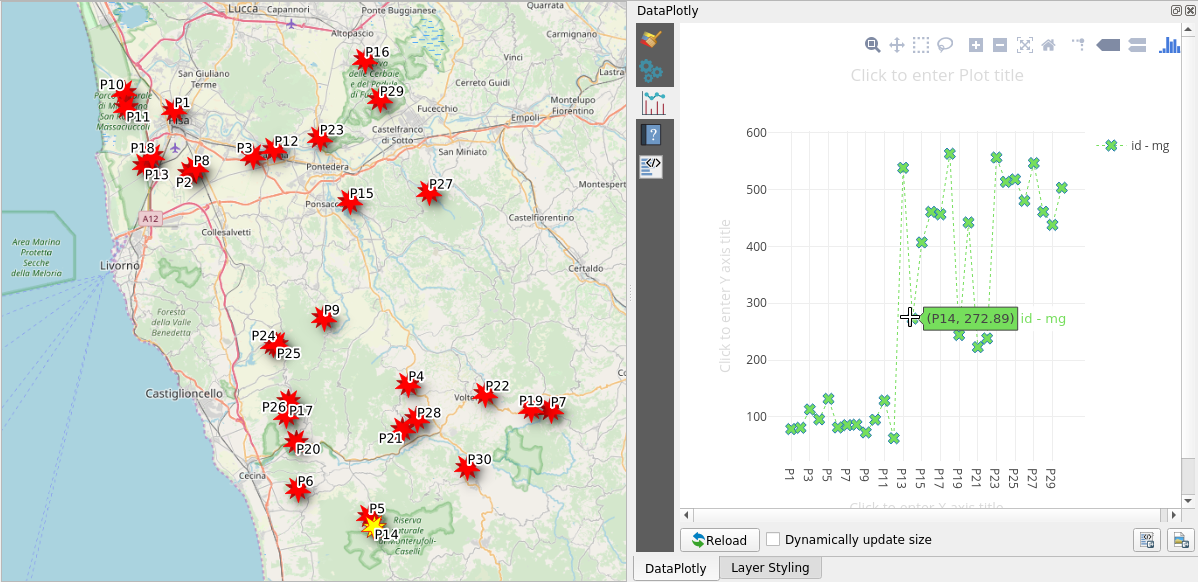
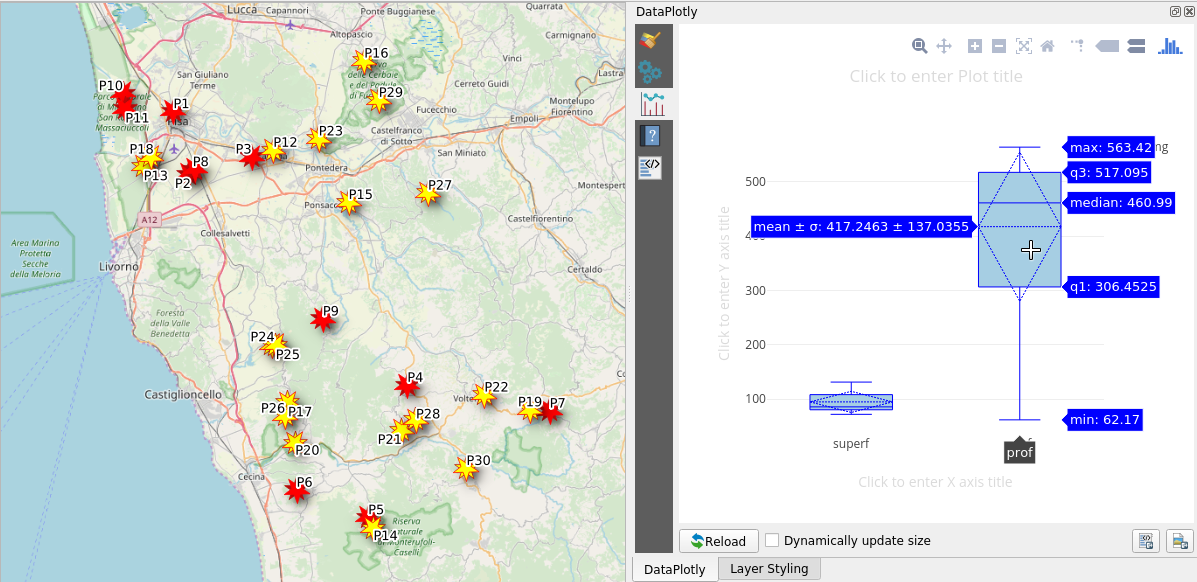
Besides all the plot and customization available, the plot is linked with the QGIS map canvas:
Usage
DataPlotly works only with QGIS 3. No additional libraries are necessary.
Gallery
Single Plot
Some examples of single plot type with some options. The list is far away to show all the possibilities.
Scatter Plot
Box Plot with statistics
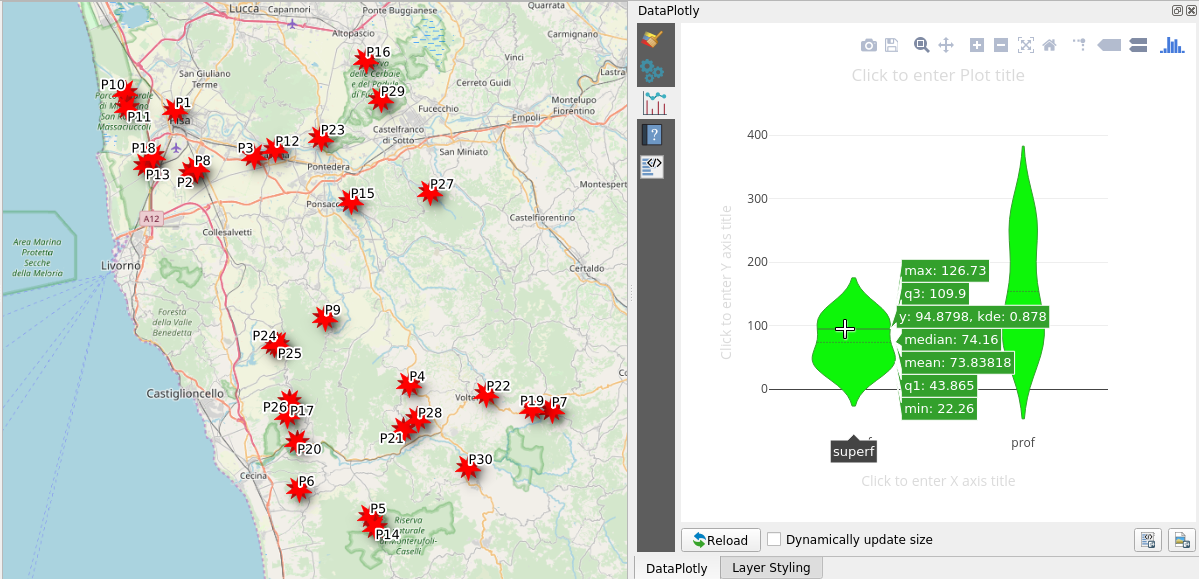
Violin Plot
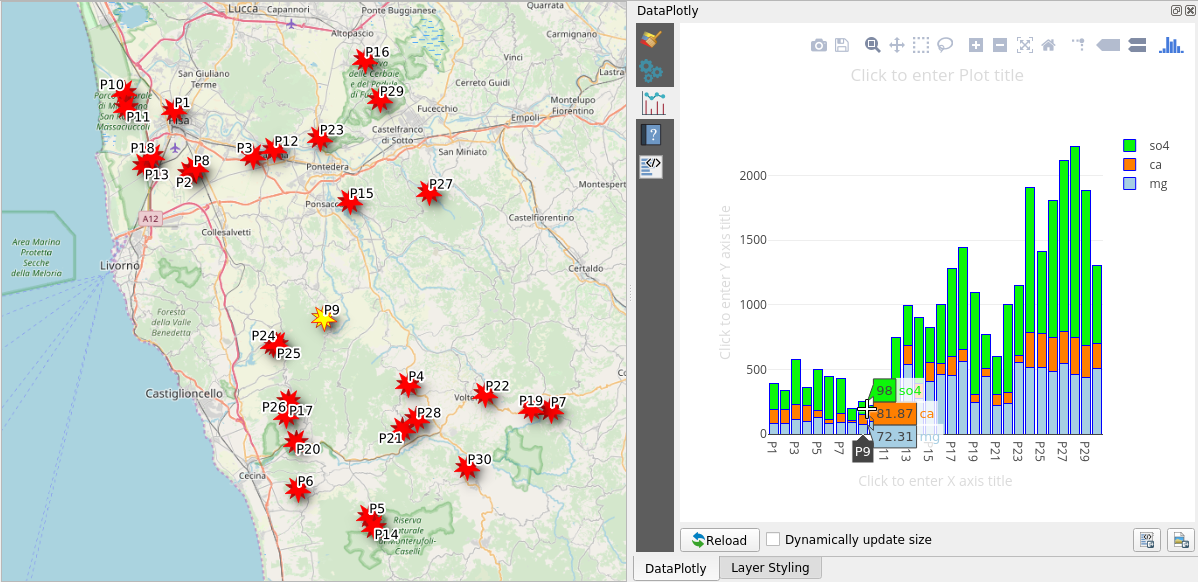
Stacked Bar Plot
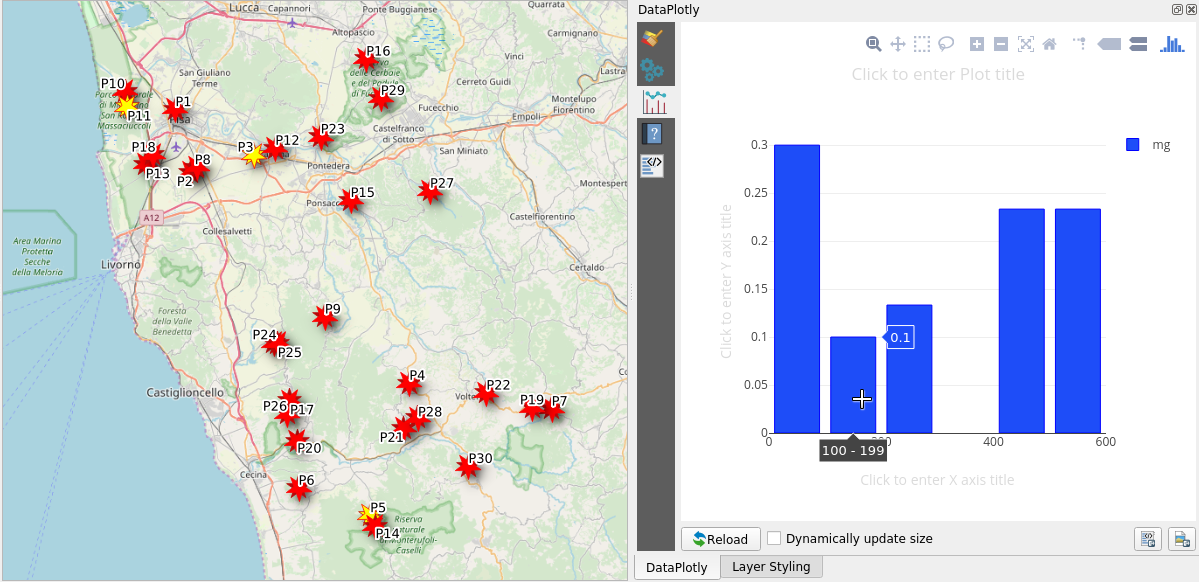
Probability Histogram
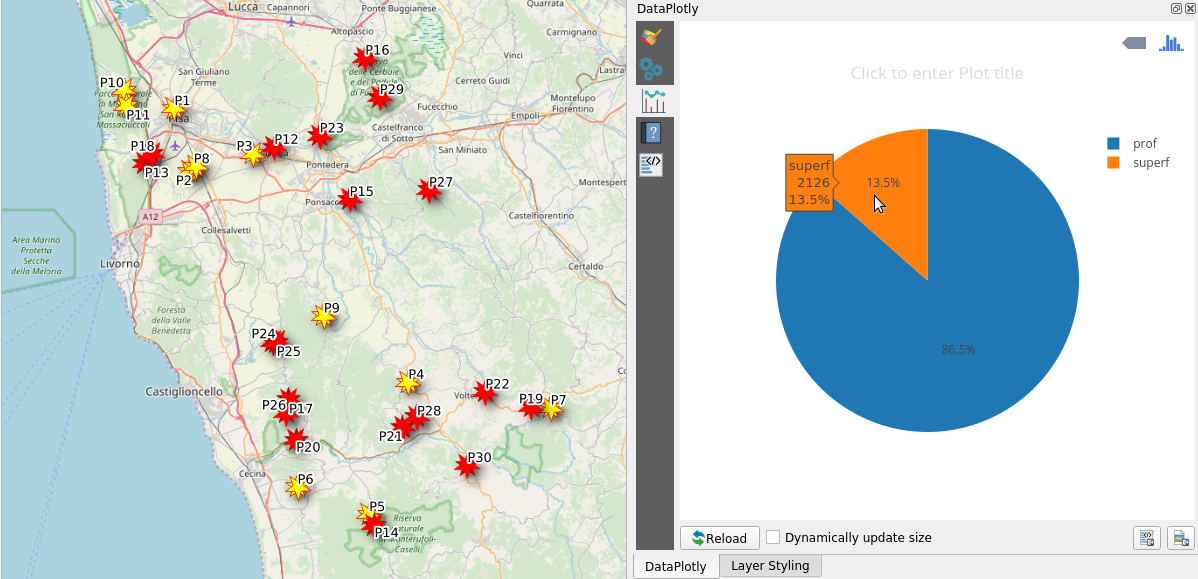
Pie Chart
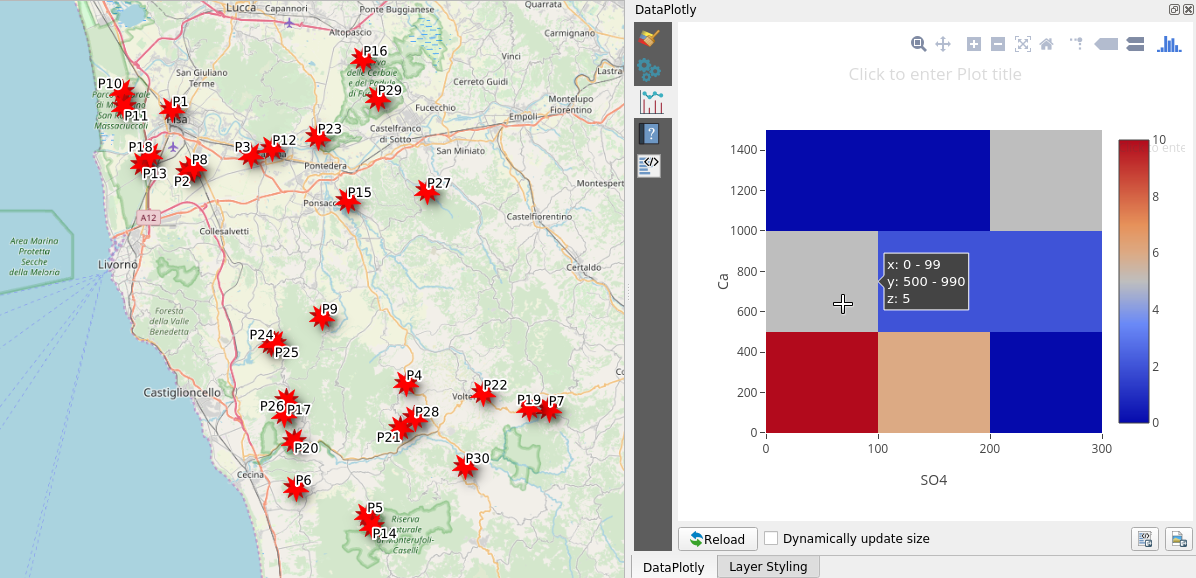
2D Histogram
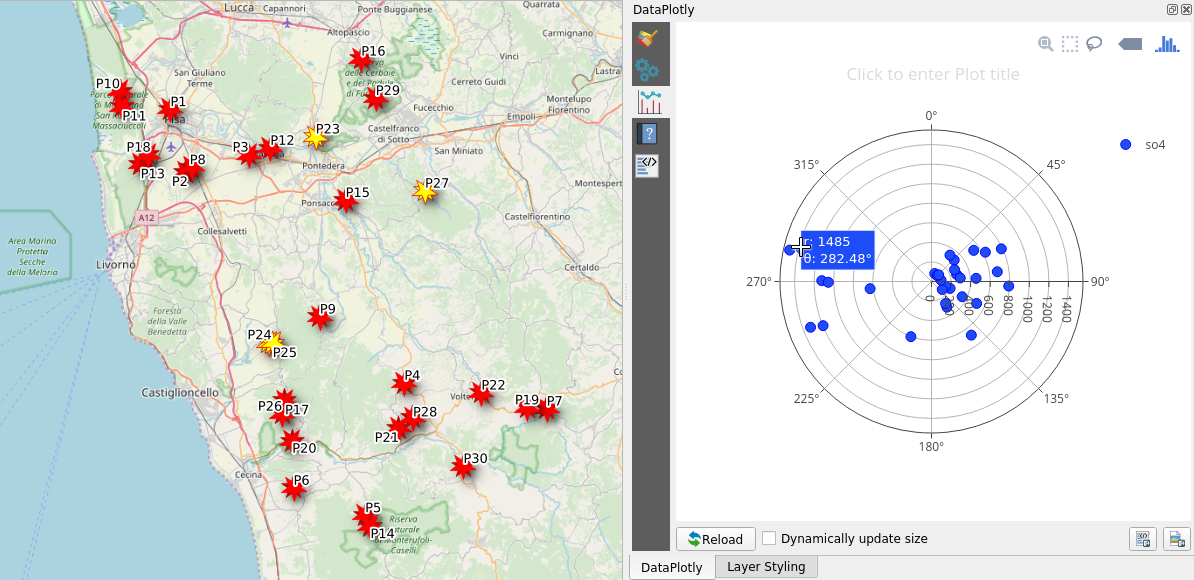
Polar Plot
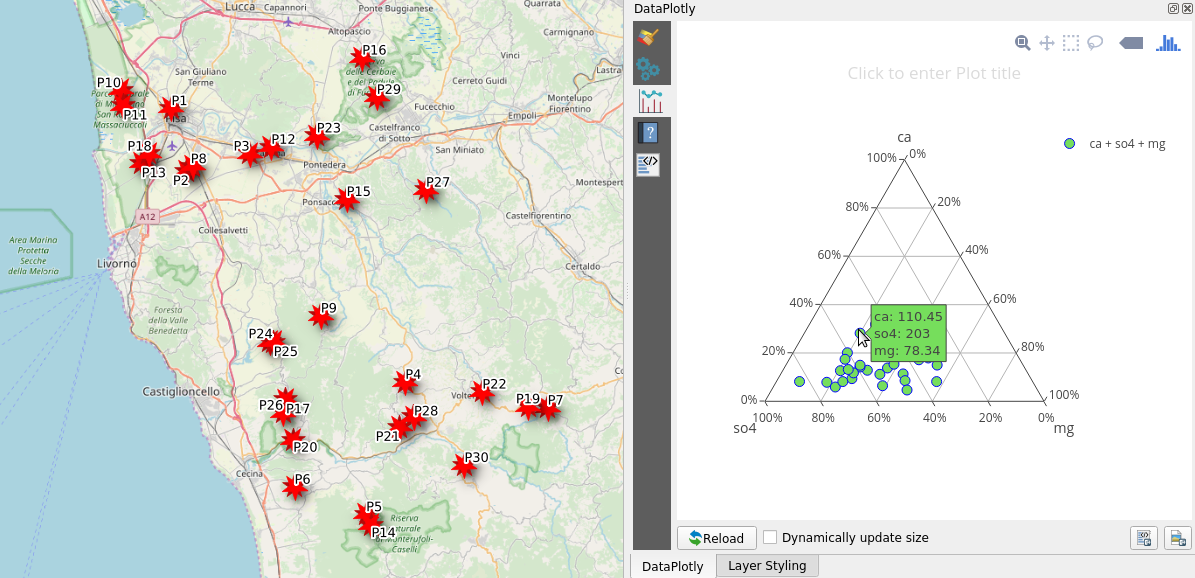
Ternary Plot
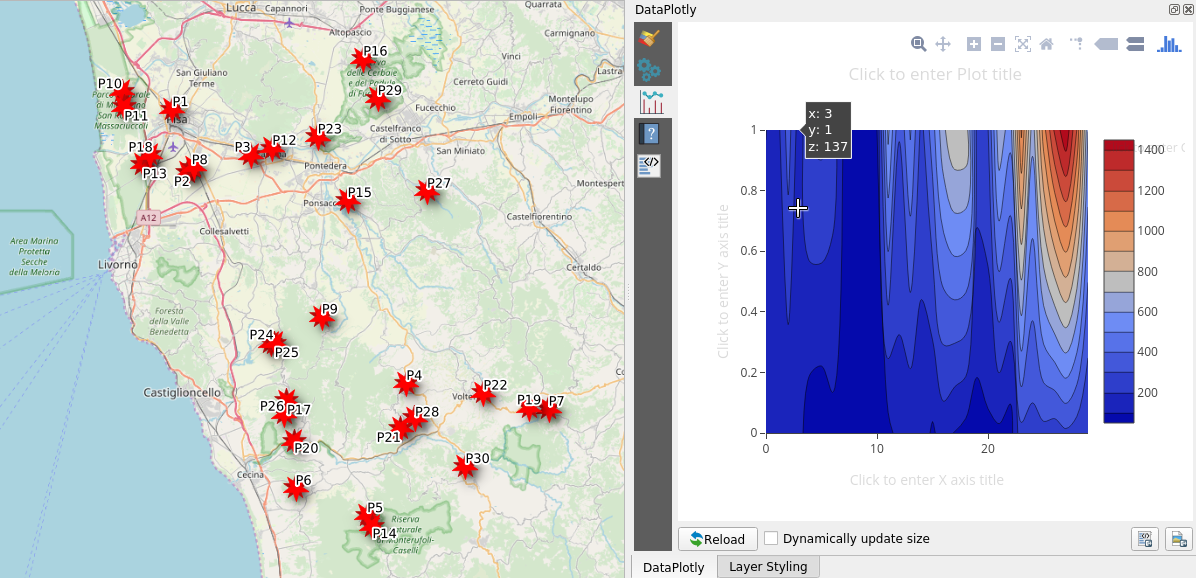
Contour Plot
Multi Plots
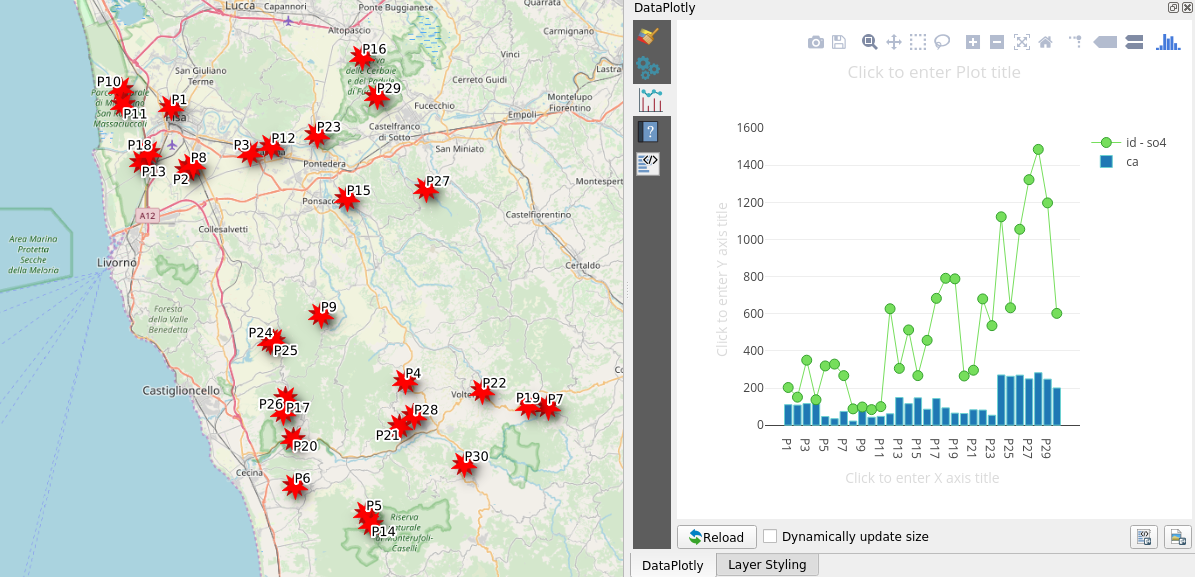
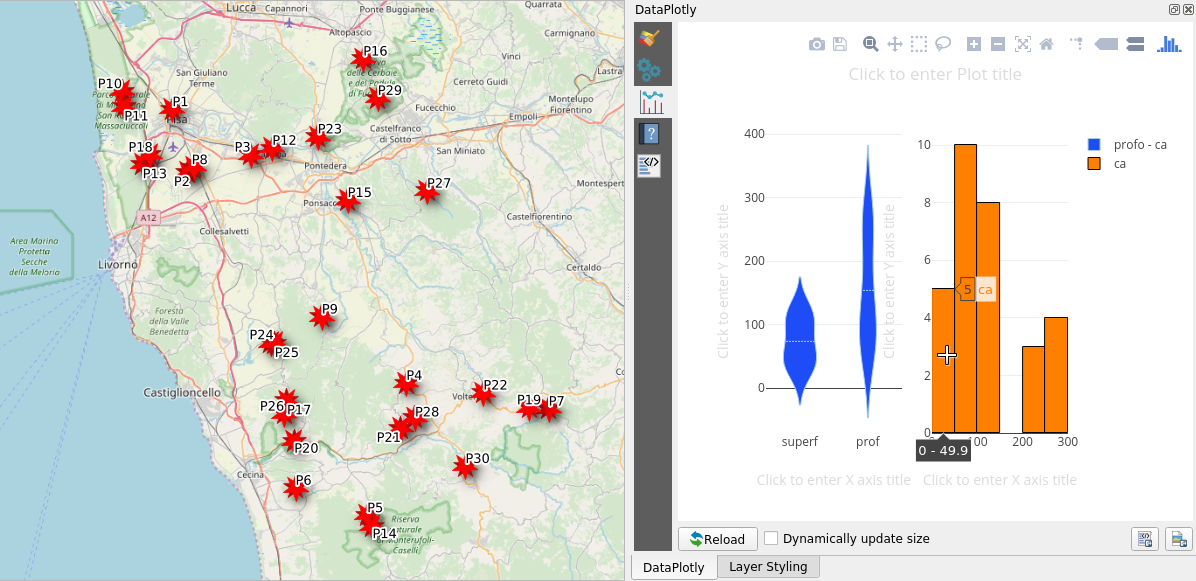
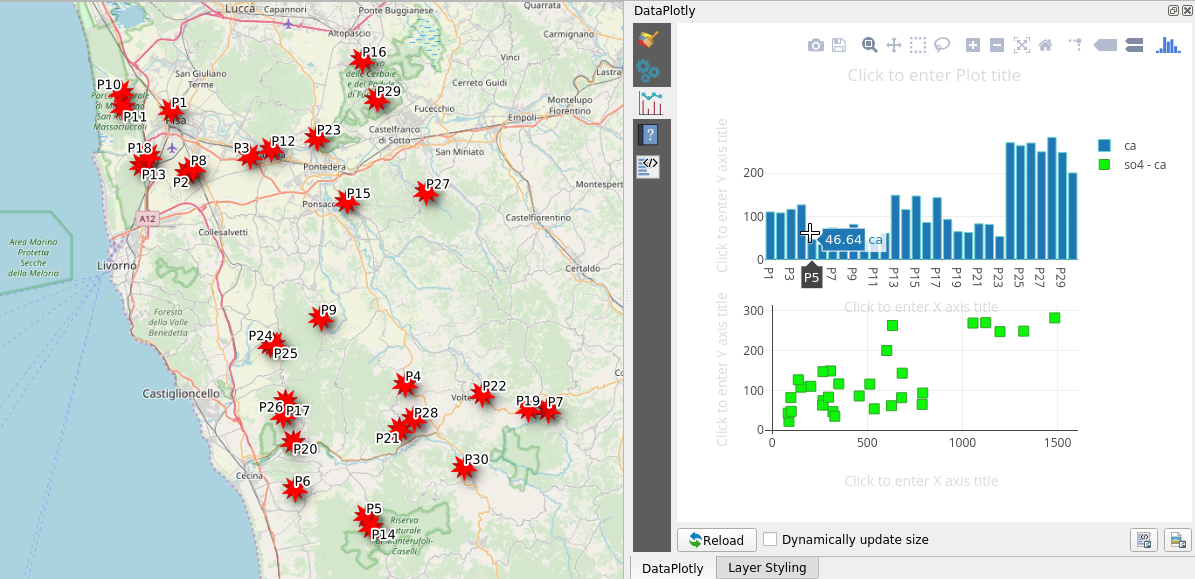
DataPloty allows creation of different plot type in the same plot canvas but also allows the chance to separate each plot in a different canvas.
Some plot are not compatible with overlapping or subplotting. A message will warn you when this happens.Overlapped Plots
Subplots in row
Subplots in column
Note that the project description data, including the texts, logos, images, and/or trademarks,
for each open source project belongs to its rightful owner.
If you wish to add or remove any projects, please contact us at [email protected].

