opstree / Druid Exporter
Projects that are alternatives of or similar to Druid Exporter
Druid Exporter
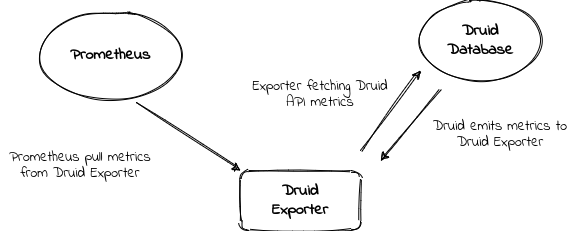
A Golang based exporter captures druid API metrics as well as JSON emitted metrics and convert them into Prometheus time-series format.
Some of the metrics collections are:-
- Druid's health metrics
- Druid's datasource metrics
- Druid's segment metrics
- Druid's supervisor metrics
- Druid's tasks metrics
- Druid's components metrics like:- broker, historical, ingestion(kafka), coordinator, sys
and many more...
Architecture
Purpose
The aim of creating this druid exporter was to capture all of the metrics that druid exposes or emits. JMX Exporter can be used to obtain JVM based metrics.
You can find examples of JMX exporter metrics here
Supported Features
- Configuration values with flags and environment variables
- HTTP basic auth username and password support
- HTTP TLS support for collecting druid API metrics
- Log level and format control via flags and env variables
- API based metrics and emitted metrics of Druid
Available Options or Flags
See the help page with --help
$ ./druid-exporter --help
usage: druid-exporter [<flags>]

Flags:
      --help                 Show context-sensitive help (also try --help-long and --help-man).
      --druid.user=""        HTTP basic auth username, EnvVar - DRUID_USER. (Only if it is set)
      --druid.password=""    HTTP basic auth password, EnvVar - DRUID_PASSWORD. (Only if it is set)
      --insecure.tls.verify  Boolean flag to skip TLS verification, EnvVar - INSECURE_TLS_VERIFY.
      --tls.cert=""          A pem encoded certificate file, EnvVar - CERT_FILE. (Only if tls is configured)
      --tls.key=""           A pem encoded key file, EnvVar - CERT_KEY. (Only if tls is configured)
      --tls.ca=""            A pem encoded CA certificate file, EnvVar - CA_CERT_FILE. (Only if tls is configured)
  -d, --druid.uri="http://druid.opstreelabs.in"
                             URL of druid router or coordinator, EnvVar - DRUID_URL
  -p, --port="8080"          Port to listen druid exporter, EnvVar - PORT. (Default - 8080)
  -l, --log.level="info"     Log level for druid exporter, EnvVar - LOG_LEVEL. (Default: info)
  -f, --log.format="text"    Log format for druid exporter, text or json, EnvVar - LOG_FORMAT. (Default: text)
      --version              Show application version.
Druid Configuration Changes
There are some changes needed in the druid cluster to exploit full capabilities of druid exporter. Druid emits the metrics to different emitters. So, in druid database, we must allow the http emitter.
If you are using the druid properties file you must add this entry to the file common.properties:-
druid.emitter.http.recipientBaseUrl=http://<druid_exporter_url>:<druid_exporter_port>/druid
druid.emitter=http
In case configuration of druid are managed by environment variables:-
druid_emitter_http_recipientBaseUrl=http://<druid_exporter_url>:<druid_exporter_port>/druid
druid_emitter=http
Installation
Druid exporter can be download from release
To run the druid exporter:-
# Export the Druid Coordinator or Router URL
export DRUID_URL="http://druid.opstreelabs.in"
export PORT="8080"

./druid-exporter [<flags>]
Building From Source
Requires 1.13 => go version to compile code from source.
make build-code
Building Docker Image
This druid exporter has support for docker as well. The docker image can simply built by
make build-image
For running the druid exporter from docker image:-
# Execute docker run command
docker run -itd --name druid-exporter -e DRUID_URL="http://druid.opstreelabs.in" \
quay.io/opstree/druid-exporter:latest
Kubernetes Deployment
The Kubernetes deployment and service manifests are present under the manifests directory and you can deploy it on Kubernetes from there.
To deploy it on Kubernetes we need some basic sets of command:-
# Kubernetes deployment creation
kubectl apply -f manifests/deployment.yaml -n my_awesome_druid_namespace

# Kubernetes service creation
kubectl apply -f manifests/service.yaml -n my_awesome_druid_namespace
We recommend to use helm chart for Kubernetes deployment.
# Helm chart deployment
helm upgrade druid-exporter ./helm/ --install --namespace druid \
--set druidURL="http://druid.opstreelabs.in" \
--set druidExporterPort="8080" \
--set logLevel="info" --set logFormat="text" \
--set serviceMonitor.enabled=true --set serviceMonitor.namespace="monitoring"
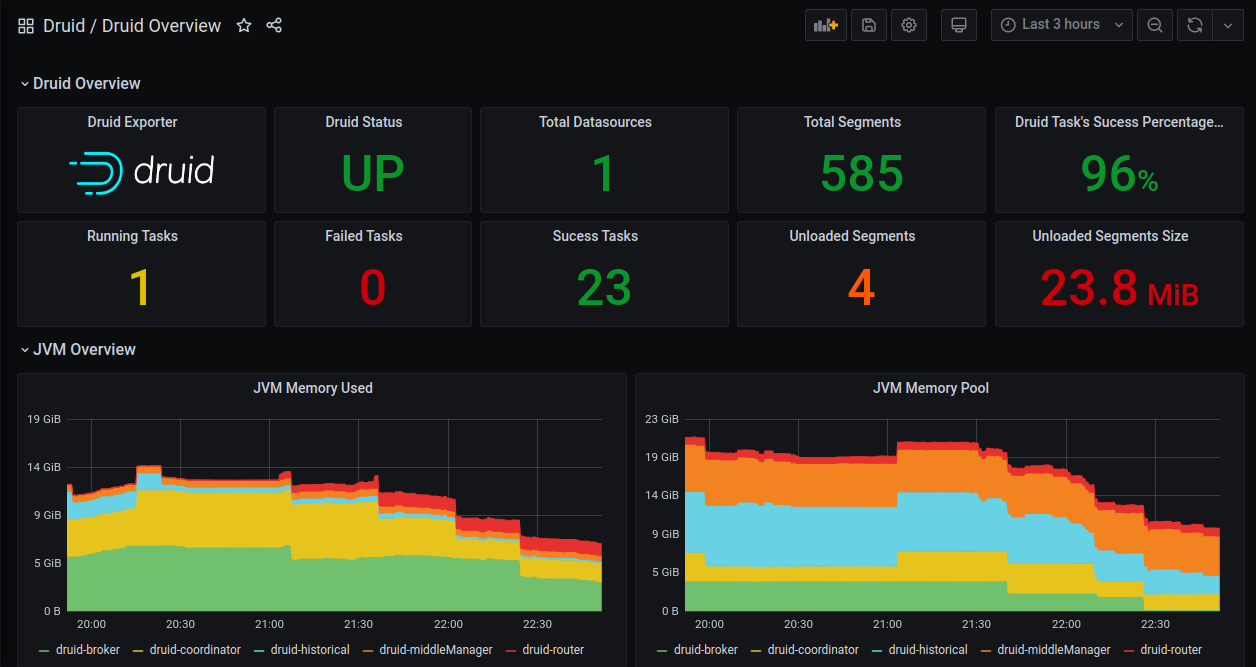
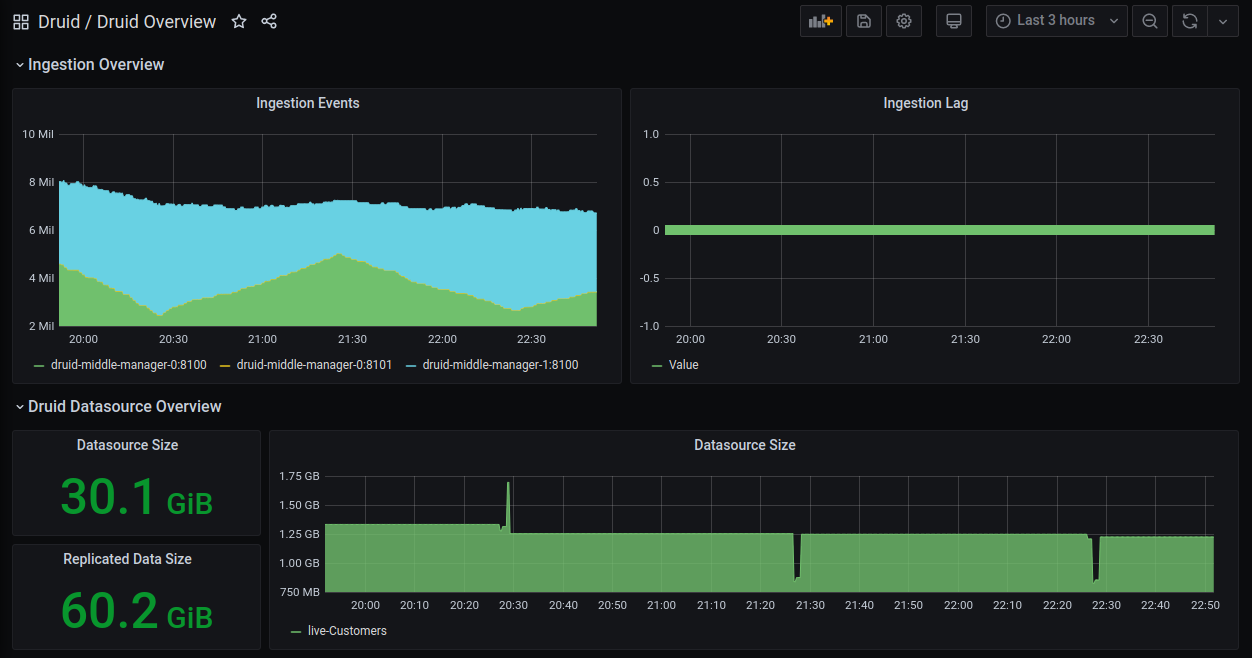
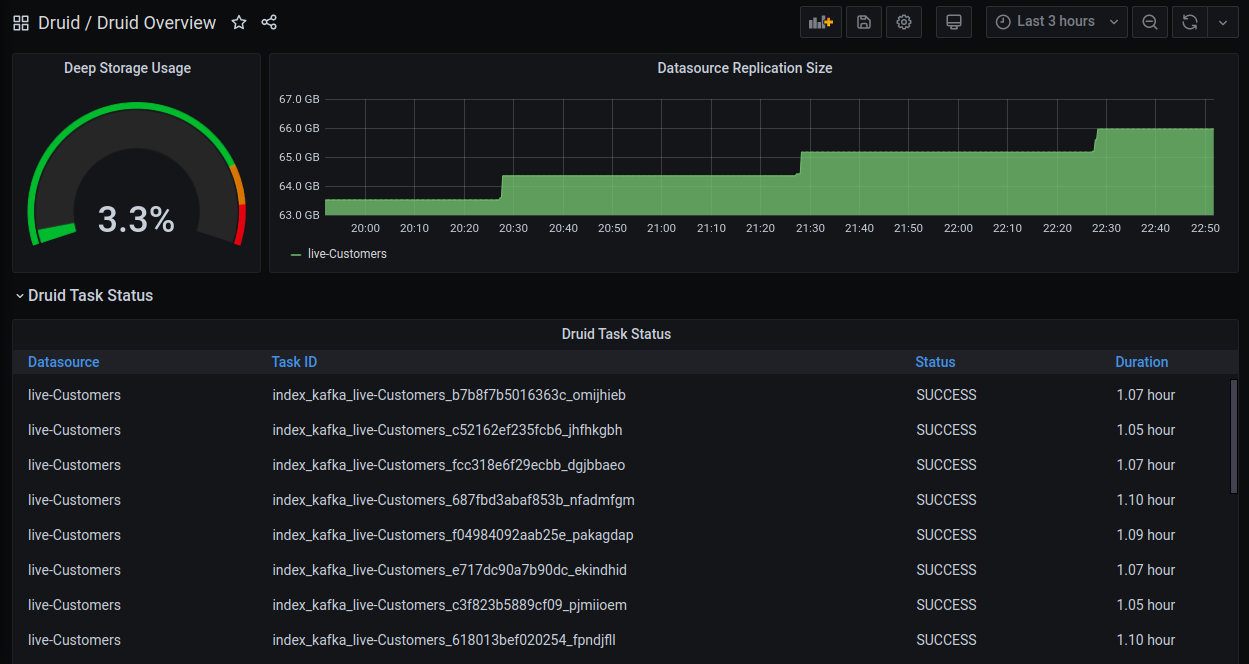
Dashboard Screenshots
Roadmap
- [x] Add docker compose setup for druid and druid exporter
- [ ] Unit test cases should be in place
- [ ] Integration test cases should be in place
- [X] Add basic auth support
- [X] Add TLS support
- [X] Add helm chart for kubernetes deployment
- [X] Create a new grafana dashboard with better insights
Development
Please see our development documentation
Release
Please see our release documentation for details
Contact
If you have any suggestion or query. Contact us at


