sherifabdlnaby / Elastdocker
Projects that are alternatives of or similar to Elastdocker

Elastic Stack on Docker with Preconfigured Security, Tools, Self-Monitoring, and Prometheus Metrics Exporters
With tools like Curator, Rubban, ElastAlert for Alerting.

![]()


![]()
Introduction
Elastic Stack (ELK) Docker Composition, preconfigured with Security, Monitoring, and Tools; Up with a Single Command.
Based on Official Elastic Docker Images
Stack Version: 7.11.1
You can change Elastic Stack version by setting
ELK_VERSIONin.envfile and rebuild your images. Any version >= 7.0.0 is compatible with this template.
Main Features 📜
- Configured as Production Single Node Cluster. (With a multi-node cluster option for experimenting).
- Deployed on a Single Docker Host or a Docker Swarm Cluster.
- Security Enabled (under basic license).
- SSL Enabled for Transport Layer and Kibana.
- Use Docker-Compose and
.envto configure your entire stack parameters. - Persist Elasticsearch's Keystore and SSL Certifications.
- Self-Monitoring Metrics Enabled.
- Prometheus Exporters for Stack Metrics.
- Embedded Container Healthchecks for Stack Images.
- ElastAlert preconfigured for Alerting.
- Curator with Crond preconfigured for Automated Scheduled tasks (e.g Snapshots to S3).
- Rubban for Kibana curating tasks.
More points
And comparing Elastdocker and the popular deviantony/docker-elk
Expand...
One of the most popular ELK on Docker repositories is the awesome deviantony/docker-elk.
Elastdocker differs from deviantony/docker-elk in the following points.
-
Security enabled by default using Basic license, not Trial.
-
Persisting data by default in a volume.
-
Run in Production Mode (by enabling SSL on Transport Layer, and add initial master node settings).
-
Persisting Generated Keystore, and create an extendable script that makes it easier to recreate it every-time the container is created.
-
Parameterize credentials in .env instead of hardcoding
elastich:changemein every component config. -
Parameterize all other Config like Heap Size.
-
Add recommended environment configurations as Ulimits and Swap disable to the docker-compose.
-
Make it ready to be extended into a multinode cluster.
-
Configuring the Self-Monitoring and the Filebeat agent that ship ELK logs to ELK itself. (as a step to shipping it to a monitoring cluster in the future).
-
Configured tools and Prometheus Exporters.
-
The Makefile that simplifies everything into some simple commands.
Requirements
- Docker 17.05 or higher
- Docker-Compose 3 or higher
- 4GB RAM (For Windows and MacOS make sure Docker's VM has more than 4GB+ memory.)
Setup
-
Clone the Repository
git clone https://github.com/sherifabdlnaby/elastdocker.git
-
Initialize Elasticsearch Keystore and TLS Self-Signed Certificates
$ make setupFor Linux's docker hosts only. By default virtual memory is not enough so run the next command as root
sysctl -w vm.max_map_count=262144 -
Start Elastic Stack
$ make elk <OR> $ docker-compose up -d
-
Visit Kibana at https://localhost:5601 or
https://<your_public_ip>:5601Default Username:
elastic, Password:changeme- Notice that Kibana is configured to use HTTPS, so you'll need to write
https://beforelocalhost:5601in the browser. - Modify
.envfile for your needs, most importantlyELASTIC_PASSWORDthat setup your superuserelastic's password,ELASTICSEARCH_HEAP&LOGSTASH_HEAPfor Elasticsearch & Logstash Heap Size.
- Notice that Kibana is configured to use HTTPS, so you'll need to write
Whatever your Host (e.g AWS EC2, Azure, DigitalOcean, or on-premise server), once you expose your host to the network, ELK component will be accessible on their respective ports.
Docker Swarm Support
Elastdocker can be deployed to Docker Swarm using make swarm-deploy
Expand
However it is not recommended to depend on Docker Swarm; if your scale needs a multi-host cluster to host your ELK then Kubernetes is the recommended next step.
Elastdocker should be used for small production workloads enough to fit on a single host.
Docker Swarm lacks some features such as
ulimitsused to disable swapping in Elasticsearch container, please changebootstrap.memory_locktofalsein docker-compose.yml and find an alternative way to disable swapping in your swarm cluster.
Additional Commands
Expand
To Start Monitoring and Prometheus Exporters
$ make monitoring
To Start Tools (ElastAlert, Rubban, and Curator)
$ make tools
To Start Elastic Stack, Tools and Monitoring
$ make all
To Start 2 Extra Elasticsearch nodes (recommended for experimenting only)
$ make nodes
To Rebuild Images
$ make build
Bring down the stack.
$ make down
Reset everything, Remove all containers, and delete DATA!
$ make prune
Configuration
- Some Configuration are parameterized in the
.envfile.-
ELASTIC_PASSWORD, userelastic's password (default:changemepls). -
ELK_VERSIONElastic Stack Version (default:7.11.1) -
ELASTICSEARCH_HEAP, how much Elasticsearch allocate from memory (default: 1GB -good for development only-) -
LOGSTASH_HEAP, how much Logstash allocate from memory. - Other configurations which their such as cluster name, and node name, etc.
-
- Elasticsearch Configuration in
elasticsearch.ymlat./elasticsearch/config. - Logstash Configuration in
logstash.ymlat./elasticsearch/config/logstash.yml. - Logstash Pipeline in
main.confat./elasticsearch/pipeline/main.conf. - Kibana Configuration in
kibana.ymlat./kibana/config. - ElastAlert Configuration in
./tools/elastalert/config. - ElastAlert Alert rules in
./tools/elastalert/rules, head to ElastAlert docs to lookup how to create alerts. - Curator Actions at
./tools/curator/actionsand./tools/curator/crontab. - Rubban Configuration using Docker-Compose passed Environment Variables.
Setting Up Keystore
You can extend the Keystore generation script by adding keys to ./setup/keystore.sh script. (e.g Add S3 Snapshot Repository Credentials)
To Re-generate Keystore:
make keystore
Enable SSL on HTTP
By default, only Transport Layer has SSL Enabled, to enable SSL on HTTP layer, add the following lines to elasticsearch.yml
## - http
xpack.security.http.ssl.enabled: true
xpack.security.http.ssl.key: certs/elasticsearch.key
xpack.security.http.ssl.certificate: certs/elasticsearch.crt
xpack.security.http.ssl.certificate_authorities: certs/ca.crt
xpack.security.http.ssl.client_authentication: optional
⚠️ Enabling SSL on HTTP layer will require all clients that connect to Elasticsearch to configure SSL connection for HTTP, this includes all the current configured parts of the stack (e.g Logstash, Kibana, Curator, etc) plus any library/binding that connects to Elasticsearch from your application code.
Notes
-
Adding Two Extra Nodes to the cluster will make the cluster depending on them and won't start without them again.
-
Makefile is a wrapper around
Docker-Composecommands, usemake helpto know every command. -
Elasticsearch will save its data to a volume named
elasticsearch-data -
Elasticsearch Keystore (that contains passwords and credentials) and SSL Certificate are generated in the
./secretsdirectory by the setup command. -
Make sure to run
make setupif you changedELASTIC_PASSWORDand to restart the stack afterwards. -
For Linux Users it's recommended to set the following configuration (run as
root)sysctl -w vm.max_map_count=262144By default, Virtual Memory is not enough.
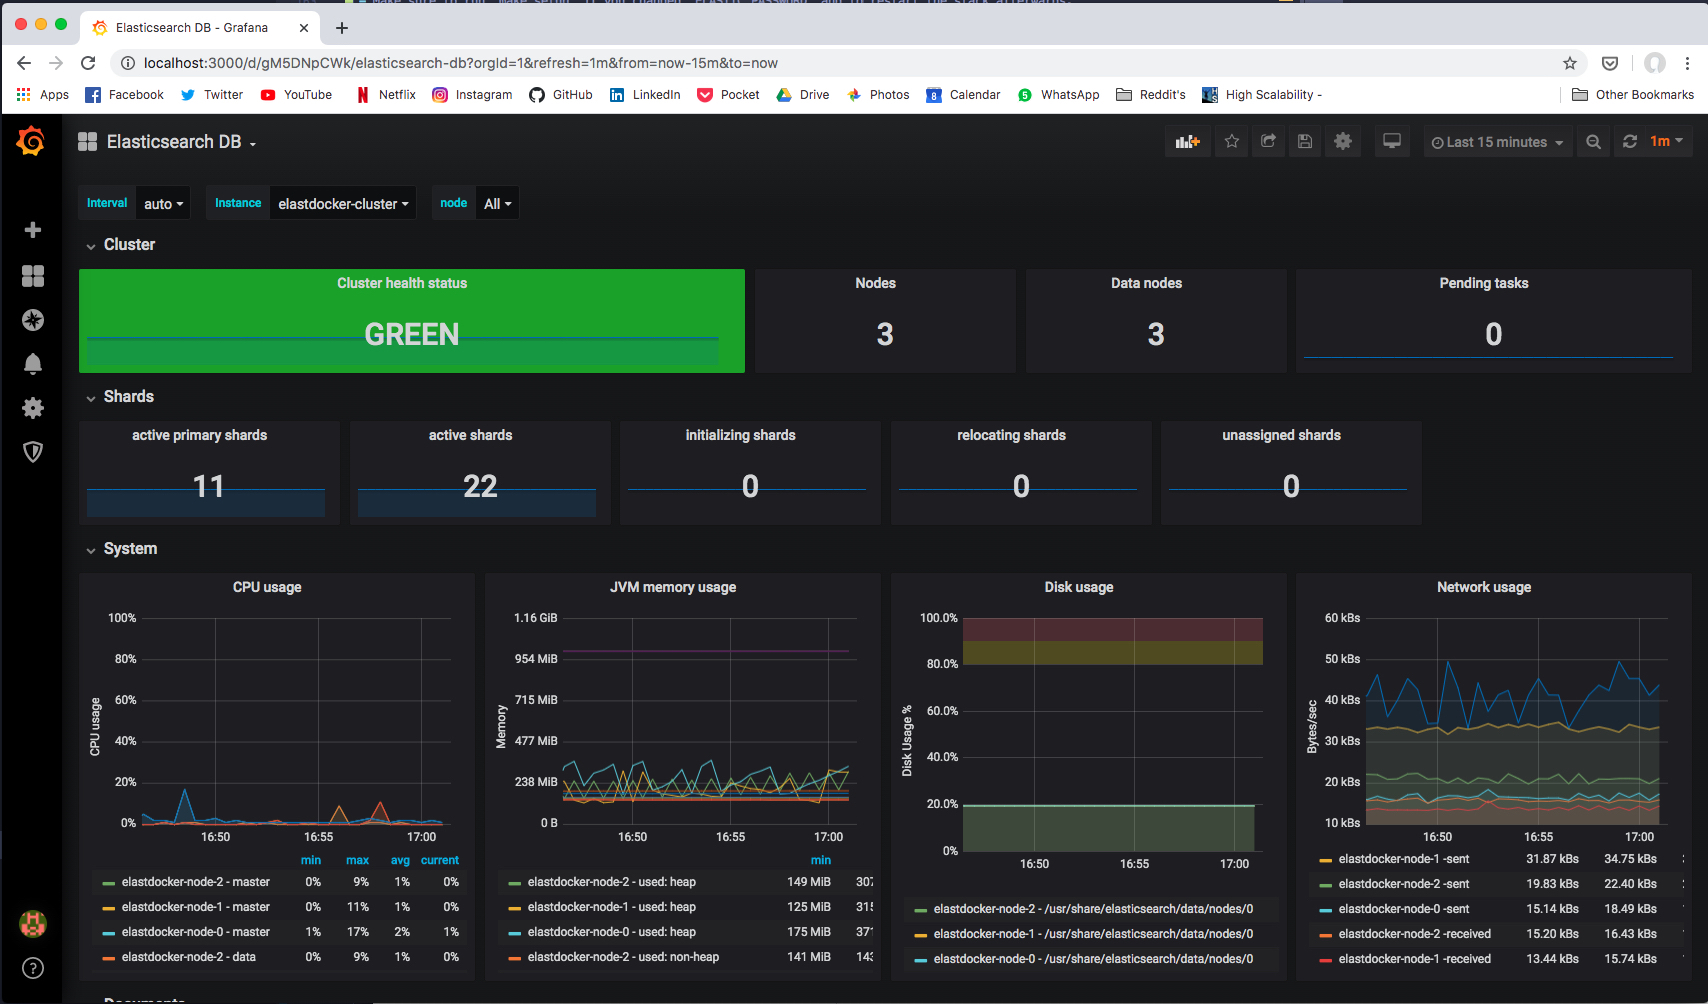
Monitoring The Cluster
Via Prometheus Exporters
If you started Prometheus Exporters using make monitoring command. Prometheus Exporters will expose metrics at the following ports.
| Prometheus Exporter | Port | Recommended Grafana Dashboard |
|---|---|---|
elasticsearch-exporter |
9114 |
Elasticsearch by Kristian Jensen |
logstash-exporter |
9304 |
logstash-monitoring by dpavlos |
Via Self-Monitoring
Head to Stack Monitoring tab in Kibana to see cluster metrics for all stack components.
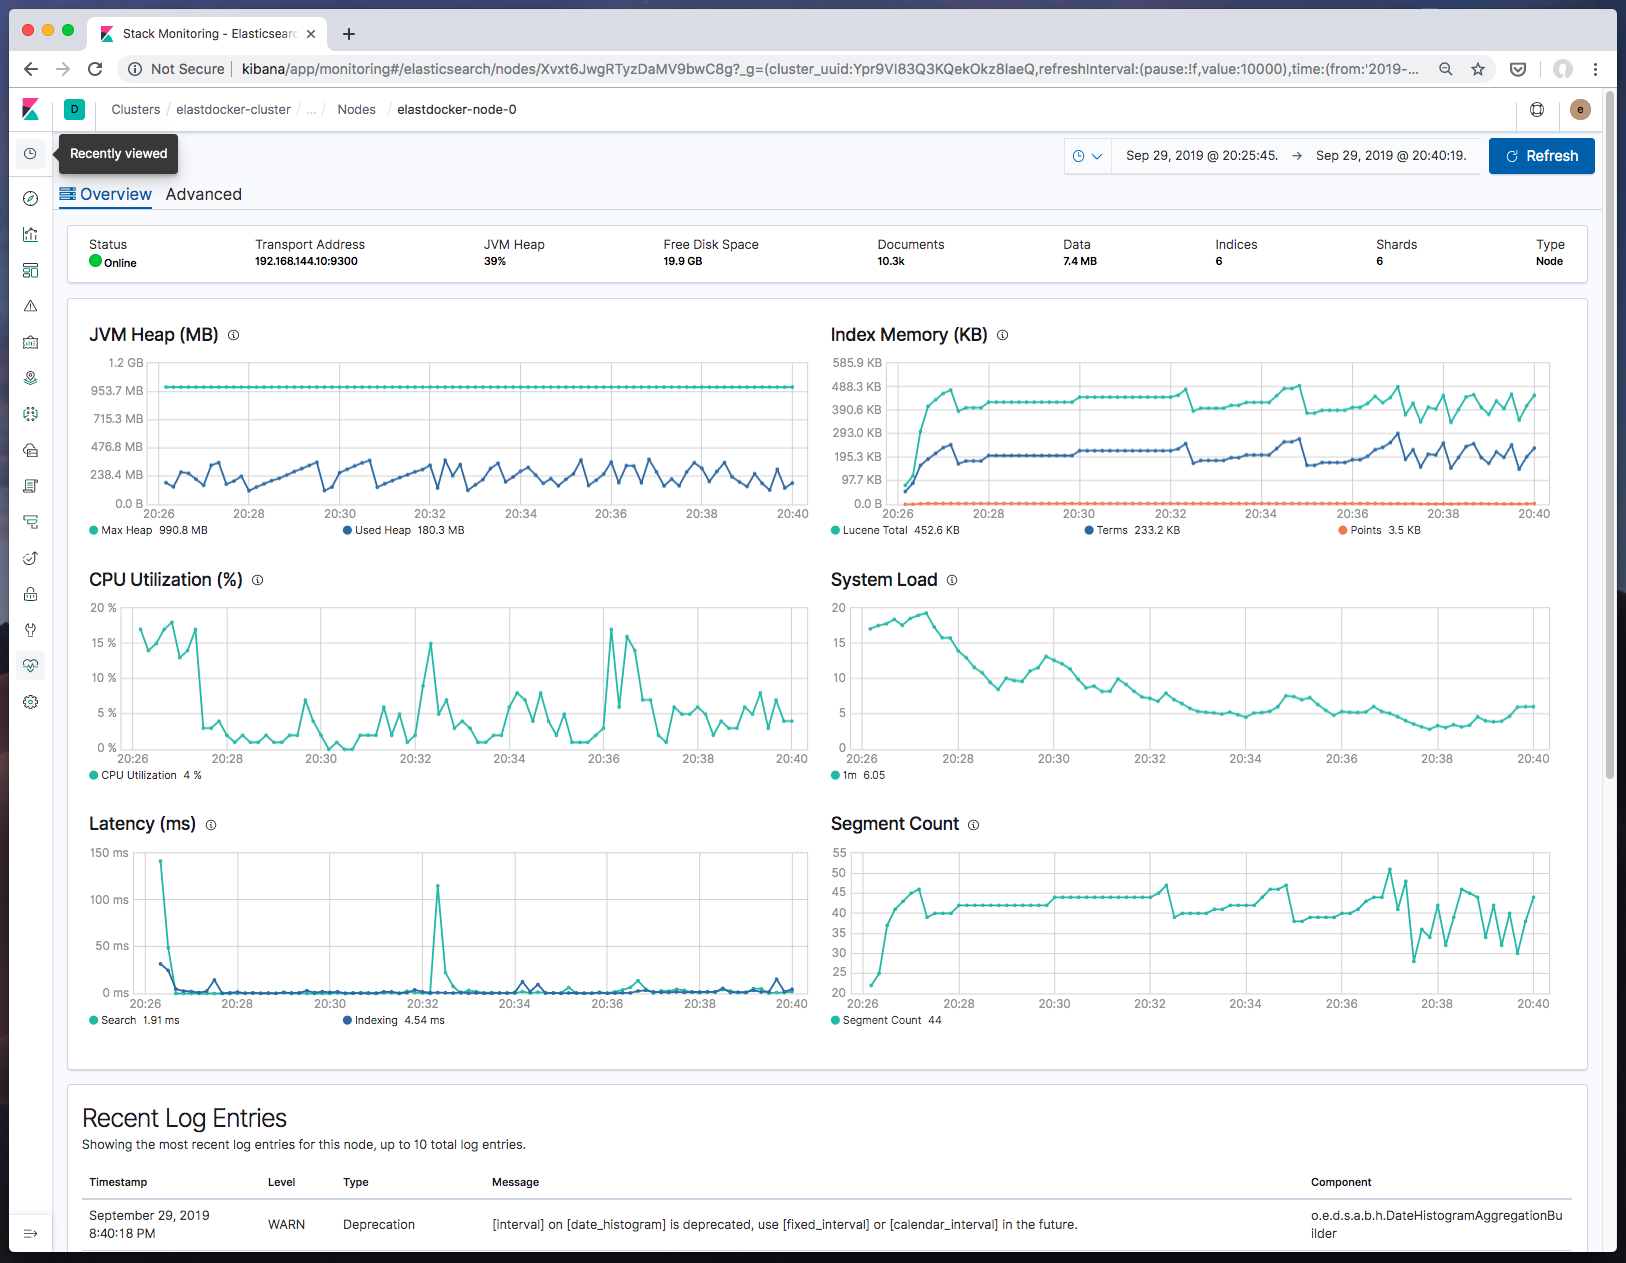

In Production, cluster metrics should be shipped to another dedicated monitoring cluster.
License
MIT License Copyright (c) 2020 Sherif Abdel-Naby
Contribution
PR(s) are Open and Welcomed.