EM3DVP:
a Visual Package for 3D Geo-Electromagnetic modeling and inversion
EM3DVP is a package of Matlab scripts. Its primary goal is to provide the users of EM methods an easy-to-use and (hopefully) comprehensive GUI to prepare the input model, data and parameter files for the 3D inversion codes, as well as an interface to plot the result models and responses. Note that this apparently works only for structured mesh.
something like a disclaimer
I wrote the package just for the convenience of myself and my colleagues/students in our group. Those who want to try this script are free to use it on academic/educational cases. But of course, I cannot guarantee the script to be working properly and calculating correctly (although I wish so). Have you any questions or suggestions, please feel free to contact me (but don't you expect that I will reply quickly!).
HOW TO GET IT
git clone https://github.com/dong-hao/EM3DVP/ your_local_folder
UNITS
The internal unit here is the 'practical' one, as used in most survey files (mV/km/nT) for E/B. To convert to Ohm (used by Weerachai's code) one needs to multiply the values by ~796. To convert to V/m/T (used by ModEM) one needs to multiply the values by 0.001
SIGN
The internal time harmonic sign convention is plus (+), or exp(i\omega t). Be careful when you need to deal with data with (-) convention.
ERRORS
Currently the internal error here is standard deviation, it worths noting that most of the survey file formats use variance (this code used variances as well before 2017). WARNING: I haven't touched that part for WSINV3D format, there must be some potential bugs lurking somewhere.
HOW TO GET UPDATED
cd to_you_local_folder
git pull
MISC NOTES
I decided to use a new system of version as the package name keeps going longer... Now I simply call it EM3DVP... Also, I tried to remove any rude words within my comments... If you found some part of the comments uncomfortable, please let me know.
Release History
- 0.0.6
- a couple of bug fixes when adding topography/bathymetry to the model - fixed a bug when locating which mesh grid a site is, and correct the site elevation so that the elevation is consistent with the model air/sea layer depth. Another quick fix is for the callback when one inputs the centre/reference point for the projection. Also modified the site projection strategy to use the median location of the stations as the center/reference coordinate when the study region is small enough (< 1 by 1 degree).
- 0.0.5
- a couple of new features - now supports "Anisotrophy" features by generating high/low resistivity fine stripes, which cannot be resolved by isotropic modelling. Also updated a long forgoten feature to extract 1D layered resistivity at a given surface point of 3D model.
- 0.0.4
- bug fixes and a couple of features - adding the function to build a tear layer with a boundary file; adding the option to export the induction vector information to be plotted with third party programes (e.g. GMT); the program now display the RMS in a different manner - the RMSs for tipper and impedance are now displayed in separate values.
- 0.0.3
- fixed an old (and purely cosmetic) bug in displaying the errorbar for impedance phases. This was not of importance as it did not affect the actual errorbar in the outputted data.
- 0.0.2
- some minor modifications mostly for dealing with poorly formatted data and model files
- 0.0.1
- initial implement
Contact
DONG Hao – [email protected]
China University of Geosciences, Beijing
Distributed under the GPL v3 license. See LICENSE for more information.
[https://github.com/dong-hao/EM3DVP]
Contributing
Those who are willing to contribute are welcomed to try - but I probably won't have the time to review the commits frequently (not that I would expect there will be any).
- Fork it (https://github.com/dong-hao/EM3DVP/fork)
- Create your feature branch (
git checkout -b feature/somename) - Commit your changes (
git commit -am 'Add some features') - Push to the branch (
git push origin feature/somename) - Create a new Pull Request - lather, rinse, repeat
Commercial Usage
Commercial usage is not forbidden by the license - but you are recommended to contact Dr. Naser Meqbel for his more advanced GUI. You will get a more robust software with more useful features. Visit his website: http://www.consulting-geo.com for details. I should ask him for affiliate commission (reads: money) for posting his link here!
Getting Started
a. prerequisite
Modelling: You can begin your modelling from (literally) scratch with EM3DVP. However, if you plan to include topography/bathymetry in your model, you will need digital elevation data in .xyz format (lon lat elev) for EM3DVP to read. If you have designed your site distribution in other software, you will also have to convert them into xyz format (Northing Easting Elevation). Pre-existed ModEM/WSINV3D/WinGlink Models can be imported.
inversion: you will need your MT field data files (.EDI files) as well as the digital elevation file or model files, as described in modelling part.
b. prepare input files for forward/inversion
load data: click the "Load EDIs" button on the "model creating interface" to load EDI files in a GUI file manager. Alternately, you can click the "IMPORT" pop-up menu to import ModEM or WSINV3D data. Once you loaded the data, the sites will be automatically projected from Geological coordinates using UTM projection. A default model will also be automatically generated for the sites.
in "data settings" interface:
site projection: you can manually select the projection "zero point" using "fixed" radio button and arbitrary LAT/LON as project centre. If "automatic" is selected, the middle value of LAT/LON from all sites will be used as the project centre.
data selection: you can select data responses used in forward/inversion in "data select" box. tick "Zxx&Zyy" for diagonal impedances, "Zxy&Zyx" for off-diagonal impedances, and "Tx&Ty" for tippers. Select the period range with the upper and lower bond after "Periods:" in "data select" box. Set the number of periods per octave after "Periods/Octave:".
error setting: you can manually set data error with the "fixed" radio button in "data error" box. Given error will be used for diagonal, off-diagonal impedances and tipper respectively. If "from data" is selected, original data error will be used.
in "model generation" interface model parameter: you can manually set the model mesh parameters in "model generation" interface X,Y,Z are the Northing, Easting and Vertical coordinates respectively. By hitting "generate", a new homogeneous half space model will be generated using the following parameters, as described below. x block width: width of the x blocks within the core area. x outcore blocks: number of x blocks out of the core area. x outcore step: increasing step for x blocks out of the core. y block width: width of the y blocks within the core area. y outcore blocks: number of y blocks out of the core area. y outcore step: increasing step for y blocks out of the core. y block width: width of the y blocks within the core area. y outcore blocks: number of y blocks out of the core area. y outcore step: increasing step for y blocks out of the core. z first thickness: thickness of the first z layer. z incore step: increasing step for z layers within the core. z incore layers: number of z layers within the core area. z outcore step: increasing step for z layers out of the core. z outcore layers: number of z layers out of the core area. background res.: default resistivity of the generated model.
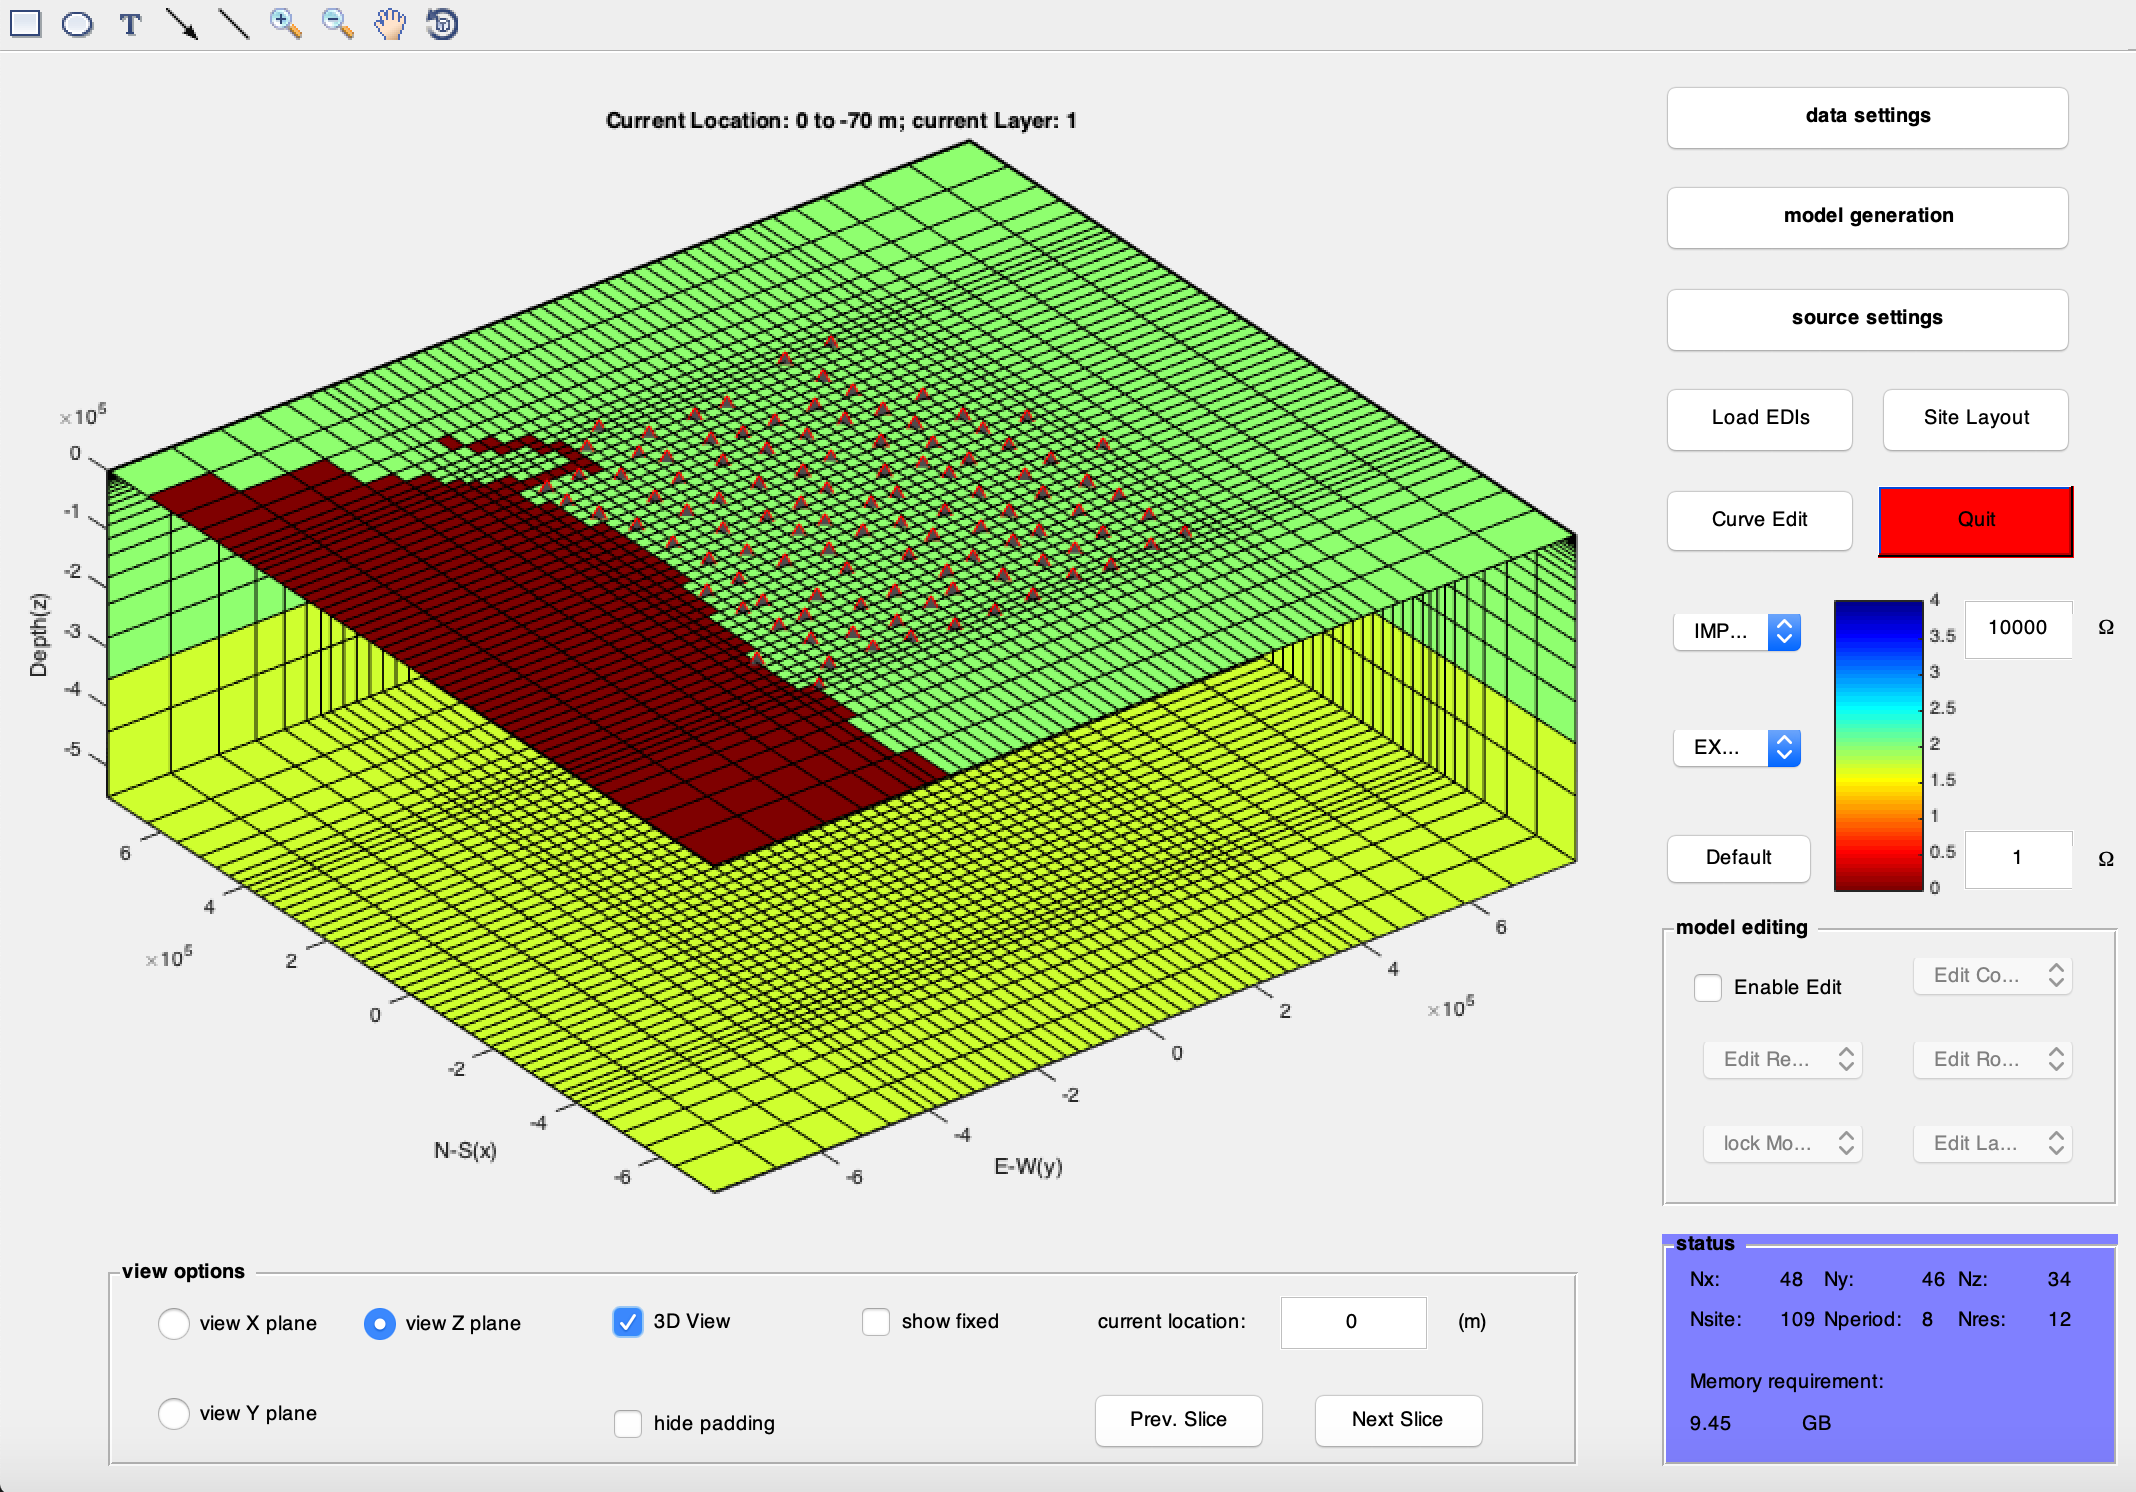
model display: you can plot the 3d model slices in X, Y or Z plane by selection in the "view option" box. By clicking the "Prev. slice" or "Next slice" button, you can browse through the model slice by slice. The current slice location is displayed on the top of the model plot. Some brief information of the model and data is displayed at the bottom-right corner of the interface. model editing: you can manually edit the model mesh and the model resistivity by enabling the "model editing" box. use the "edit column", "edit row" and "edit layer" pop-up menus to edit the different direction of meshes. use the "Edit resist." pop-up menu to edit the resistivity of the model.
Bathymetry or topography can also be automatically added to the model by using the "Edit resist." -> "Add Topo"/"Add Bathy." pop-up menu. You will be prompted to load the digital elevation data file afterwards. use the "Lock model" pop-up menu to prevent part of the model from changing in inversions.
data editing: you can display the data curve and mask data (site-wise) by clicking the "Curve edit" button and calling the Curve Editor interface. save input files: you can export the input files needed for WSINV3D or ModEM from the "EXPORT" pop-up menu.
c. run the forward/inversion
Please note that even though we have a "run" button on the main menu, the forward/inversion code is not provided with this package. You will have to provide the right executables/codes to run with it. It is not really a recommended way to run the inversions either, saves the purely demonstrational purposes.
...just refer to your EM code guide lines for specific commands...
d. display the inversion results
load the output files: Click "Load Model" in the "plot results and models" interface. You will be prompted to select the preferred inversion model and input data in a GUI interface. Once the model and data are loaded, three plots will be generated to display the X (N-S), Y (E-W) and Z (Horizontal) slices respectively. You can change the aspect of 2D or 3D in the "aspect" box. You can also clicking your way through different slices by choosing one of the three planes in "selection" box and hitting the "Previous" or "Next" button. By ticking the "show profile area only" box, you can limit the plots within the region with sites. colour map and shading: you can select your preferred colour map and colour shading (interpolated or not) with the "colormap" and "shading" pop-up menu.
display the RMS variation: click the "view RMS" button to call the iteration RMS viewer interface. For ModEM, you will select the inversion log file to load the RMS info. you will have to select all models to see RMS variation with WSINV3D. display the data response: click the "view resp" button to call the model response viewer interface. You can select one site from the site map to plot and compare the observed data and calculated responses.
display the iso-surface: click the "view isosfc" button to call the iso-surface viewer interface. You can plot iso-surfaces at different values with orthogonal (x,y,z-direction) slices. display
oblique profile section: click the "profile" button to call the profile section viewer interface. You can make any oblique profile on a map and plot the section below the profile.
Q & A
Q: Do you support *** format?
A: Well, for input data - EM3DVP supports EDI (despite the fact that everyone hates it), Weerachai's ascii and ModEM "list" formats. Note that transfer functions like phase tensors are not supported (at all), as I have not figured out a good way (or is there?) to calculate the variance of those things. Unfortunately, none of these shiny new formats, like Anna's xml or Maximum's json format, is supported. Although I would be happy if someone wants to contribute the supports for those formats. for input models - EM3DVP can import Weerachai's ascii format (which is also used in ModEM) and Randy's 3D ascii format from WinGlink. Likewise, I am quite open to add port for new format - contribution is always welcomed.
Q: Why are the sites "shifted" from the original location sometimes after the inversion?
A: As Weerachai never explicitly defined the "zero point" of the model space, something like "shifting" could happen if one has data file (site projection) and model file (model projection) with different "zero point" set (especially when one has a non-uniformly distributed site layout, i.e. you have more sites in the west than in the east). I treat the problem by force the zero point of the model file to be the centre of the model, as explained in the "save_model" function comment in the code.
Q: What the hell are the numbers in the input slots below the "set boundary" tick, in "settings" box, "plot results and models" interface?
A: The three numbers are the number of padding cells NOT TO be displayed on each side of the model. For example, 6 in the first slot means the most north 6 cells and the most south 6 cells will not be displayed in the plot (so that we can concentrate in our study area). Likewise, the 8 in the third slot means the deepest 8 layers will not be displayed in the plot (so that we can concentrate in the shallow part).