All Projects → pilosus → flask_prometheus_metrics

pilosus / flask_prometheus_metrics

Licence: MIT License
Prometheus Metrics for Flask Web App

Programming Languages

python
139335 projects - #7 most used programming language
Makefile
30231 projects

Projects that are alternatives of or similar to flask prometheus metrics

Prometheus
Kubernetes Setup for Prometheus and Grafana
Stars: ✭ 824 (+4747.06%)
Mutual labels:  metrics, grafana, prometheus
Citrix Adc Metrics Exporter
Export metrics from Citrix ADC (NetScaler) to Prometheus
Stars: ✭ 67 (+294.12%)
Mutual labels:  metrics, grafana, prometheus
Unifiedmetrics
Fully-featured metrics collection agent for Minecraft servers. Supports Prometheus and InfluxDB. Dashboard included out-of-box.
Stars: ✭ 29 (+70.59%)
Mutual labels:  metrics, grafana, prometheus
Docker monitoring logging alerting
Docker host and container monitoring, logging and alerting out of the box using cAdvisor, Prometheus, Grafana for monitoring, Elasticsearch, Kibana and Logstash for logging and elastalert and Alertmanager for alerting.
Stars: ✭ 479 (+2717.65%)
Mutual labels:  metrics, grafana, prometheus
Appmetrics
App Metrics is an open-source and cross-platform .NET library used to record and report metrics within an application.
Stars: ✭ 1,986 (+11582.35%)
Mutual labels:  metrics, grafana, prometheus
Swagger Stats
API Observability. Trace API calls and Monitor API performance, health and usage statistics in Node.js Microservices.
Stars: ✭ 559 (+3188.24%)
Mutual labels:  metrics, grafana, prometheus
Promcord
📊 Analyze your entire discord guild in grafana using prometheus. Message, User, Game and Voice statistics...
Stars: ✭ 39 (+129.41%)
Mutual labels:  metrics, grafana, prometheus
Iota Prom Exporter
Iota Exporter for Prometheus Metrics
Stars: ✭ 33 (+94.12%)
Mutual labels:  metrics, grafana, prometheus
Heplify Server
HEP Capture Server
Stars: ✭ 110 (+547.06%)
Mutual labels:  metrics, grafana, prometheus
Grafana
The open and composable observability and data visualization platform. Visualize metrics, logs, and traces from multiple sources like Prometheus, Loki, Elasticsearch, InfluxDB, Postgres and many more.
Stars: ✭ 45,930 (+270076.47%)
Mutual labels:  metrics, grafana, prometheus
octane-exporter
Export Laravel Octane metrics using this Prometheus exporter.
Stars: ✭ 14 (-17.65%)
Mutual labels:  metrics, grafana, prometheus
Prometheus Book
Prometheus操作指南
Stars: ✭ 2,637 (+15411.76%)
Mutual labels:  metrics, grafana, prometheus
Hastic Server
Hastic data management server for analyzing patterns and anomalies from Grafana
Stars: ✭ 292 (+1617.65%)
Mutual labels:  metrics, grafana, prometheus
Grafterm
Metrics dashboards on terminal (a grafana inspired terminal version)
Stars: ✭ 613 (+3505.88%)
Mutual labels:  metrics, grafana, prometheus
chia-monitor
🍃 A comprehensive monitoring and alerting solution for the status of your Chia farmer and harvesters.
Stars: ✭ 131 (+670.59%)
Mutual labels:  metrics, grafana, prometheus
Pingprom
Prometheus uptime monitoring quickstart
Stars: ✭ 107 (+529.41%)
Mutual labels:  metrics, grafana, prometheus
Github Monitoring
Monitor your GitHub Repos with Docker & Prometheus
Stars: ✭ 163 (+858.82%)
Mutual labels:  metrics, grafana, prometheus
Docker Traefik Prometheus
A Docker Swarm Stack for monitoring Traefik with Promethues and Grafana
Stars: ✭ 215 (+1164.71%)
Mutual labels:  metrics, grafana, prometheus
gateway
A proxy to buffer and forward metrics, events, and traces.
Stars: ✭ 94 (+452.94%)
Mutual labels:  metrics, prometheus
epiphany
Cloud and on-premises automation for Kubernetes centered industrial grade solutions.
Stars: ✭ 114 (+570.59%)
Mutual labels:  grafana, prometheus

Flask Prometheus Metrics

Build Status Test Coverage Maintainability Code style: black

Prometheus metrics exporter for Flask web applications.

flask_prometheus_metrics uses official Prometheus Python Client providing basic metrics about process resource usage, app's requests metrics and information.

Installation

pip install -U flask_prometheus_metrics

You will need Flask to run examples below:

pip install -U 'flask_prometheus_metrics[flask]'

Usage

Run the following minimal example in Python shell:

from flask import Flask
from prometheus_client import make_wsgi_app
from werkzeug.middleware.dispatcher import DispatcherMiddleware
from werkzeug.serving import run_simple
from flask_prometheus_metrics import register_metrics

app = Flask(__name__)

@app.route("/")
def index():
    return "Test"

# provide app's version and deploy environment/config name to set a gauge metric
register_metrics(app, app_version="v0.1.2", app_config="staging")

# Plug metrics WSGI app to your main app with dispatcher
dispatcher = DispatcherMiddleware(app.wsgi_app, {"/metrics": make_wsgi_app()})

run_simple(hostname="localhost", port=5000, application=dispatcher)

Then go over http://localhost:5000/, refresh page a few times and check your app's metrics at http://localhost:5000/metrics.

See also example.py for more elaborate example of library usage in real Flask applications.

Metrics

flask_prometheus_metrics exposes the following application metrics:

  • app_request_latency_seconds (histogram) - Application request latency
  • app_request_count_total (counter) - application request count
  • app_version_info (gauge) - application version

Library also provides some metrics about a Python interpreter used and process resource usage:

  • python_gc_objects_collected_total (counter) - objects collected during gc
  • python_gc_objects_uncollectable_total (counter) - uncollectable object found during GC
  • python_gc_collections_total (counter) - number of times this generation was collected
  • python_info (gauge) - Python platform information
  • process_virtual_memory_bytes (gauge) - virtual memory size in bytes
  • process_resident_memory_bytes (gauge) - resident memory size in bytes
  • process_start_time_seconds (gauge) - start time of the process since unix epoch in seconds
  • process_cpu_seconds_total (counter) - total user and system CPU time spent in seconds
  • process_open_fds (gauge) - number of open file descriptors
  • process_max_fds (gauge) - maximum number of open file descriptors

Grafana dashboard

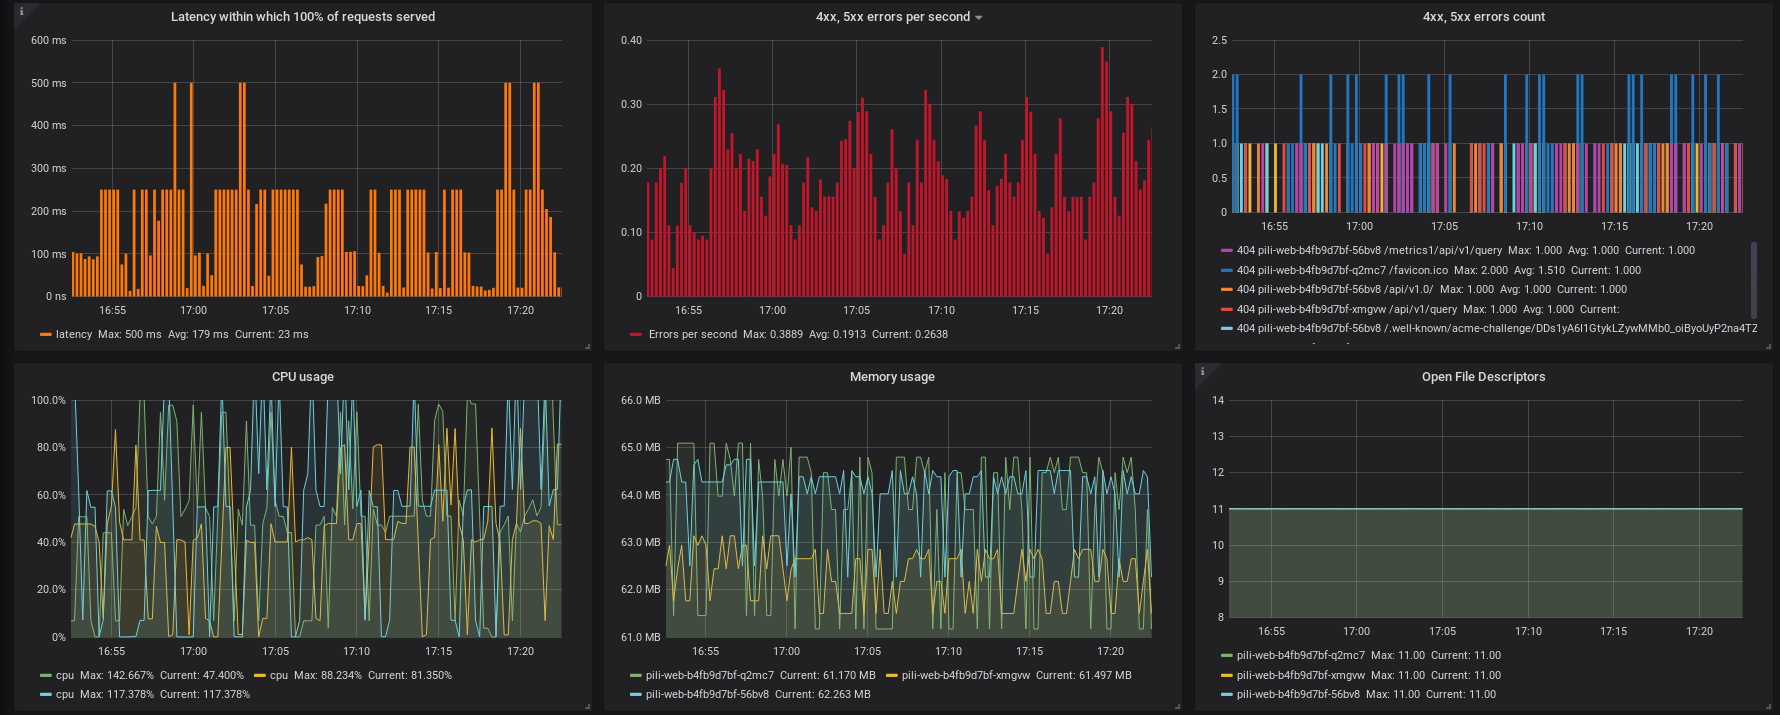
The metrics exported by flask_prometheus_metrics can be scraped by Prometheus monitoring system and then visualized in Grafana.

You can download Grafana dashboard crafted specifically for the flask_prometheus_metrics default metrics here.

Grafana visualisation

Testing

When testing Flask application with DispatcherMiddleware (see Usage example above) you may want to use a little hack in order to make Flask's test_client() work properly.

Note that the project description data, including the texts, logos, images, and/or trademarks, for each open source project belongs to its rightful owner. If you wish to add or remove any projects, please contact us at [email protected].