All Projects → Ephigenia → Foobugs Dashboard

Ephigenia / Foobugs Dashboard

various dashing dashboard jobs

Programming Languages

javascript
184084 projects - #8 most used programming language

Projects that are alternatives of or similar to Foobugs Dashboard

Ngx Dynamic Dashboard Framework
This is a JSON driven angular x based dashboard framework that is inspired by JIRA's dashboard implementation and https://github.com/raulgomis/angular-dashboard-framework
Stars: ✭ 160 (+150%)
Mutual labels:  metrics, widget, dashboard
Robinhood On Rails
A web dashboard for the free trading platform Robinhood using Ruby on Rails and a private API
Stars: ✭ 134 (+109.38%)
Mutual labels:  stock-market, dashboard
Mprove
Open source Business Intelligence tool 🎉
Stars: ✭ 212 (+231.25%)
Mutual labels:  metrics, dashboard
Chromium Dashboard
Chrome Status Dashboard
Stars: ✭ 407 (+535.94%)
Mutual labels:  metrics, dashboard
Spring Boot Actuator Demo
Spring Boot Actuator: Health Check, Metrics Gathering, Auditing, and Monitoring
Stars: ✭ 61 (-4.69%)
Mutual labels:  metrics, dashboard
Github Monitoring
Monitor your GitHub Repos with Docker & Prometheus
Stars: ✭ 163 (+154.69%)
Mutual labels:  metrics, dashboard
Mozaik
Mozaïk is a tool based on nodejs / react / redux / nivo / d3 to easily craft beautiful dashboards
Stars: ✭ 3,546 (+5440.63%)
Mutual labels:  metrics, dashboard
Kirby Matomo
Matomo integration for Kirby, in both your panel and templates. Kirby 3 only.
Stars: ✭ 103 (+60.94%)
Mutual labels:  metrics, dashboard
Grafterm
Metrics dashboards on terminal (a grafana inspired terminal version)
Stars: ✭ 613 (+857.81%)
Mutual labels:  metrics, dashboard
Prometheus
Kubernetes Setup for Prometheus and Grafana
Stars: ✭ 824 (+1187.5%)
Mutual labels:  metrics, dashboard
Devdash
🍱 Highly Configurable Terminal Dashboard for Developers and Creators
Stars: ✭ 939 (+1367.19%)
Mutual labels:  metrics, dashboard
Iota Prom Exporter
Iota Exporter for Prometheus Metrics
Stars: ✭ 33 (-48.44%)
Mutual labels:  metrics, dashboard
Phoenix live dashboard
Realtime dashboard with metrics, request logging, plus storage, OS and VM insights
Stars: ✭ 1,657 (+2489.06%)
Mutual labels:  metrics, dashboard
Hastic Grafana App
Hastic data management server for labeling patterns and anomalies in Grafana
Stars: ✭ 166 (+159.38%)
Mutual labels:  metrics, dashboard
Grafana
The open and composable observability and data visualization platform. Visualize metrics, logs, and traces from multiple sources like Prometheus, Loki, Elasticsearch, InfluxDB, Postgres and many more.
Stars: ✭ 45,930 (+71665.63%)
Mutual labels:  metrics, dashboard
Personal Dashboard
📊 Programmatically collecting and reporting various stats about myself daily
Stars: ✭ 333 (+420.31%)
Mutual labels:  metrics, dashboard
Tessera
A dashboard front-end for graphite.
Stars: ✭ 1,202 (+1778.13%)
Mutual labels:  metrics, dashboard
Amon
Amon is a modern server monitoring platform.
Stars: ✭ 1,331 (+1979.69%)
Mutual labels:  metrics, dashboard
Docker monitoring logging alerting
Docker host and container monitoring, logging and alerting out of the box using cAdvisor, Prometheus, Grafana for monitoring, Elasticsearch, Kibana and Logstash for logging and elastalert and Alertmanager for alerting.
Stars: ✭ 479 (+648.44%)
Mutual labels:  metrics, dashboard
Pgwatch2
PostgreSQL metrics monitor/dashboard
Stars: ✭ 960 (+1400%)
Mutual labels:  metrics, dashboard

VersionEye Badge

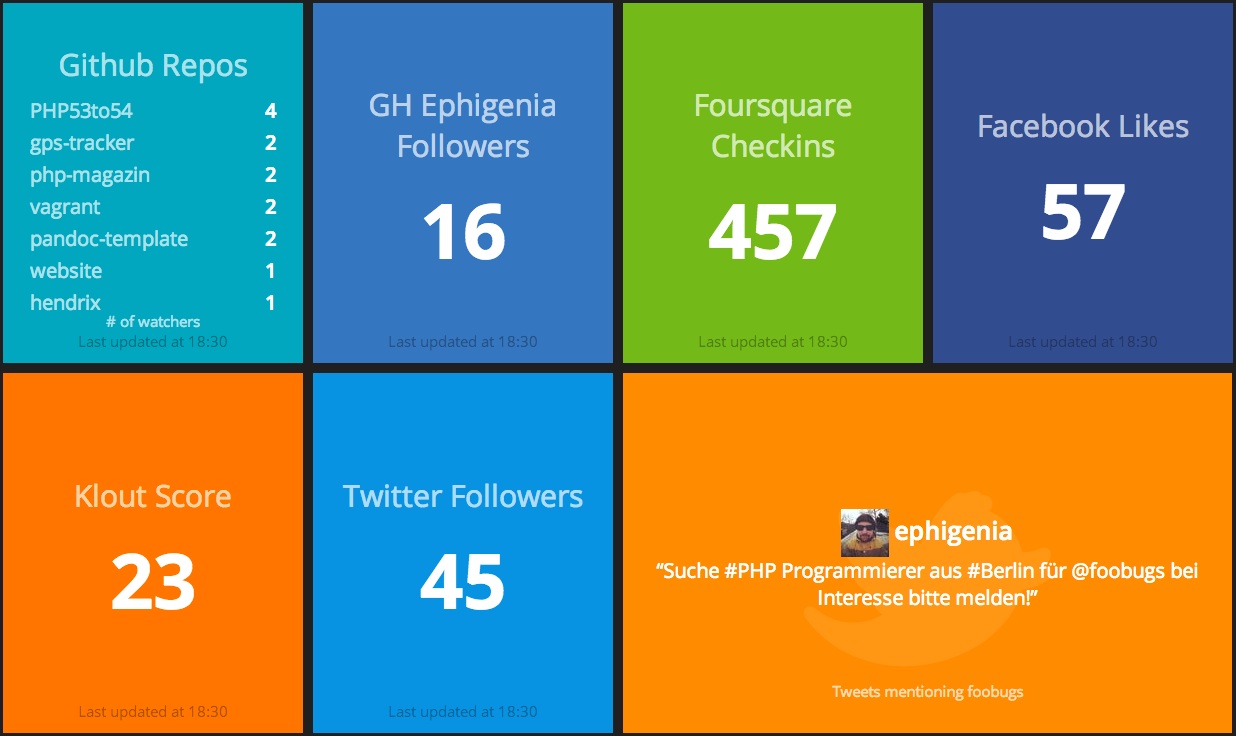
This is a customized dashing dashboard for foobugs containing a set of new widget jobs that also can be used in a fresh dashing setup.

Widgets & Jobs

All of the widgets use public APIs or regexps on scraped website content. So no need fo complicated OAuth Authentification. In most cases a user id or username is the only thing you need to get the data.

  • Facebook-page metrics (likes, checkins or talking about)
  • Foursquare venue checkins
  • GitHub repository stats (forks and watchers)
  • GitHub user metrics (followers, following, repos and gists)
  • Google play store (application score and comments count)
  • Instagram user (photos, followers, following)
  • Klout score
  • Slideshare user (count of slides, followers)
  • Twitter account (followers, following and tweets)
  • Vimeo account (likes, uploads, contacts etc.)
  • Vimeo account vidoes top-list (top-X of user’s videos)
  • Yahoo stock market quote value
  • Youtube video metrics (rating, views, likes, comments, favorites)

Using Widgets

All widgets can be displayed with the Number widget that is part of the dashing setup. Please check the sample.erb in this repository to see how to use them.

You also can copy single job files over to your own dashboard and use them there. Just place the according .rb file in your jobs directory.

What’s that for?

Image you have some KPIs you always want to see when you’re in the office. You just use dashing and the jobs you need to display them permanently on a screen. We’ve installed a permanent dashboard display using a raspberry PI and a LCD screen. We’ll blog about this in 1-2 weeks.

Demo & Screen

There are two demo dashboards installed on heroku right now:

Default Dashboard

Standard Dashboard

Stock Market Dashboard

Stock Market Example

Note that the project description data, including the texts, logos, images, and/or trademarks, for each open source project belongs to its rightful owner. If you wish to add or remove any projects, please contact us at [email protected].