All Projects → tessera-metrics → Tessera

tessera-metrics / Tessera

Licence: apache-2.0
A dashboard front-end for graphite.

Programming Languages

typescript
32286 projects

Projects that are alternatives of or similar to Tessera

Netdata
Real-time performance monitoring, done right! https://www.netdata.cloud
Stars: ✭ 57,056 (+4646.76%)
Mutual labels:  monitoring, graphite, dashboard
Pgwatch2
PostgreSQL metrics monitor/dashboard
Stars: ✭ 960 (-20.13%)
Mutual labels:  monitoring, metrics, dashboard
Hastic Server
Hastic data management server for analyzing patterns and anomalies from Grafana
Stars: ✭ 292 (-75.71%)
Mutual labels:  monitoring, metrics, graphite
Kenshin
Kenshin: A time-series database alternative to Graphite Whisper with 40x improvement in IOPS
Stars: ✭ 203 (-83.11%)
Mutual labels:  monitoring, metrics, graphite
Spring Boot Actuator Demo
Spring Boot Actuator: Health Check, Metrics Gathering, Auditing, and Monitoring
Stars: ✭ 61 (-94.93%)
Mutual labels:  monitoring, metrics, dashboard
Graphite exporter
Server that accepts metrics via the Graphite protocol and exports them as Prometheus metrics
Stars: ✭ 217 (-81.95%)
Mutual labels:  monitoring, metrics, graphite
Carbon Relay Ng
Fast carbon relay+aggregator with admin interfaces for making changes online - production ready
Stars: ✭ 429 (-64.31%)
Mutual labels:  monitoring, metrics, graphite
Appmetrics
App Metrics is an open-source and cross-platform .NET library used to record and report metrics within an application.
Stars: ✭ 1,986 (+65.22%)
Mutual labels:  monitoring, metrics, graphite
Graylog Plugin Metrics
Graylog output plugin for Graphite and Ganglia
Stars: ✭ 16 (-98.67%)
Mutual labels:  monitoring, metrics, graphite
Prometheus
Kubernetes Setup for Prometheus and Grafana
Stars: ✭ 824 (-31.45%)
Mutual labels:  monitoring, metrics, dashboard
Icingaweb2 Module Grafana
Grafana module for Icinga Web 2 (supports InfluxDB & Graphite)
Stars: ✭ 190 (-84.19%)
Mutual labels:  monitoring, metrics, graphite
Devdash
🍱 Highly Configurable Terminal Dashboard for Developers and Creators
Stars: ✭ 939 (-21.88%)
Mutual labels:  monitoring, metrics, dashboard
Hastic Grafana App
Hastic data management server for labeling patterns and anomalies in Grafana
Stars: ✭ 166 (-86.19%)
Mutual labels:  monitoring, metrics, dashboard
Graylog Plugin Metrics Reporter
Graylog Metrics Reporter Plugins
Stars: ✭ 71 (-94.09%)
Mutual labels:  monitoring, metrics, graphite
Github Monitoring
Monitor your GitHub Repos with Docker & Prometheus
Stars: ✭ 163 (-86.44%)
Mutual labels:  monitoring, metrics, dashboard
Ceph Dash
Flask based api / dashboard for viewing a ceph clusters overall health status
Stars: ✭ 398 (-66.89%)
Mutual labels:  monitoring, graphite, dashboard
Grafana
The open and composable observability and data visualization platform. Visualize metrics, logs, and traces from multiple sources like Prometheus, Loki, Elasticsearch, InfluxDB, Postgres and many more.
Stars: ✭ 45,930 (+3721.13%)
Mutual labels:  monitoring, metrics, dashboard
Icinga2
Icinga is a monitoring system which checks the availability of your network resources, notifies users of outages, and generates performance data for reporting.
Stars: ✭ 1,670 (+38.94%)
Mutual labels:  monitoring, metrics, graphite
Metrictank
metrics2.0 based, multi-tenant timeseries store for Graphite and friends.
Stars: ✭ 574 (-52.25%)
Mutual labels:  monitoring, metrics, graphite
Logmonitor
Monitoring log files on windows systems.
Stars: ✭ 23 (-98.09%)
Mutual labels:  monitoring, metrics, graphite

Tessera

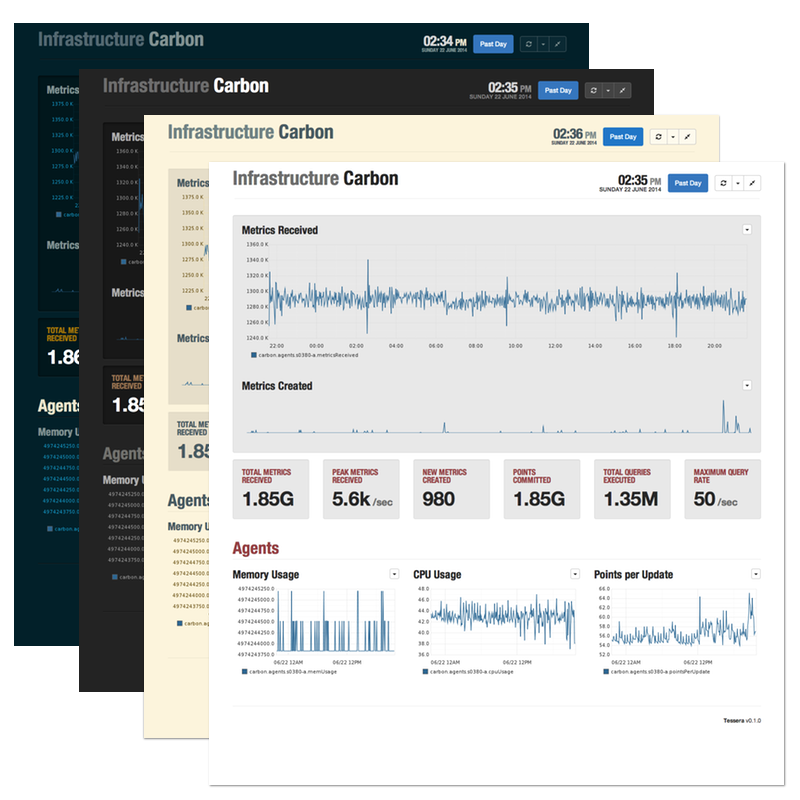
Tessera is a front-end interface for the Graphite metrics system, which provides a large selection of presentations, layout, and interactivity options for building dashboards.

The biggest key differences between Tessera and other frontends are the separation of queries from presentations, and the ability to apply arbitrary transformations to the presentations & queries, allowing for a large degree of interactivity. Tessera is initially focused on information presentation - it does not NOT address the areas of metric discovery or query composition (although it may in the future).

Overview

Tessera consists of a small python webserver written with Flask with a SQL backing store. The server manages storing and searching for dashboards, managing tags for organization, serving the basic UI assets, and providing a ReST API for the front-end to use.

Dashboards are big lumps of JSON data describing the queries, presentations, and layout, wrapped in a small shell of SQL metadata. Most of the heavy lifting is done by the javascript front-end, which is responsible for all rendering, data fetching from graphite, and editing of dashboards.

Quick Start

From Docker

If you're familiar with docker and already have a Graphite instance running, you can boot up an instance of tessera with the demo dashboards preloaded and easily point it at your existing Graphite installation using the aalpern/tessera-simple image. If you don't have a Graphite installation handy, a Docker image like nickstenning/graphite can get that up and running quickly.

docker run -P -e GRAPHITE_URL=http://graphite.host -it aalpern/tessera-simple

From PyPi

Tessera can be installed easily from PyPi with pip or easy_install. This method of installation is only recommended for casual use.

pip install tessera

After installation, create a config.py script for your local settings.

Example config.py:

GRAPHITE_URL="http://graphite.example.com"
SECRET_KEY="adf71812-9d57-88d3-dfe8-1e9860d2b7ab"

Initialize the database:

TESSERA_CONFIG=/path/to/config.py tessera-init

Then launch the service:

TESSERA_CONFIG=/path/to/config.py tessera

The service will be available on localhost:5000 by default, with the demo dashoards loaded.

From Source

The TL;DR version:

./script/setup
./script/server &
cd tessera-server
inv json.import '../demo/*'

Documentation

Documentation is hosted on GitHub Pages at tessera-metrics.github.io/tessera/docs.

  • Getting Started for getting started and running from source and importing the demo dashboards.
  • Tutorial for creating the most basic possible dashboard.
  • API endpoints and data format for accessing Tessera via the HTTP REST API
  • Extending Tessera, for adding new dashboard items, transformations, and actions.

Some additional writeup of why Tessera exists can found on the introductory blog post that was originally posted on Urban Airship's company blog - Introducing Tessera, a Graphite Frontend.

screenshot

Copyright & License

Copyright © 2014, Urban Airship and Contributors

Licensed under the Apache License, Version 2.0 (the "License"); you may not use this file except in compliance with the License. You may obtain a copy of the License at

Unless required by applicable law or agreed to in writing, software distributed under the License is distributed on an "AS IS" BASIS, WITHOUT WARRANTIES OR CONDITIONS OF ANY KIND, either express or implied. See the License for the specific language governing permissions and limitations under the License.

Third-party software libraries included with this project are distributed under their respective licenses.

Note that the project description data, including the texts, logos, images, and/or trademarks, for each open source project belongs to its rightful owner. If you wish to add or remove any projects, please contact us at [email protected].