All Projects → tevjef → Go Runtime Metrics

tevjef / Go Runtime Metrics

Licence: mit
Collect golang runtime metrics, pushing to InfluxDB or pulling with Telegraf

Programming Languages

go
31211 projects - #10 most used programming language
golang
3204 projects

Labels

Projects that are alternatives of or similar to Go Runtime Metrics

Quicklogger
Library for logging on files, console, memory, email, rest, eventlog, syslog, slack, telegram, redis, logstash, elasticsearch, influxdb, graylog, Sentry, Twilio, ide debug messages and throw events for Delphi/Firemonkey/freepascal/.NET (Windows/Linux/OSX/IOS/Android).
Stars: ✭ 137 (-44.08%)
Mutual labels:  influxdb
Logcool
A high performance and near real time log collector.
Stars: ✭ 161 (-34.29%)
Mutual labels:  influxdb
Icingaweb2 Module Grafana
Grafana module for Icinga Web 2 (supports InfluxDB & Graphite)
Stars: ✭ 190 (-22.45%)
Mutual labels:  influxdb
Aioinflux
Asynchronous Python client for InfluxDB
Stars: ✭ 142 (-42.04%)
Mutual labels:  influxdb
Influxdb.net
Cross-platform .NET library for InfluxDB distributed time-series database.
Stars: ✭ 159 (-35.1%)
Mutual labels:  influxdb
Hargo
Hargo is a Go library and command line utility that parses HAR files, can convert to curl format, and serve as a load test driver.
Stars: ✭ 164 (-33.06%)
Mutual labels:  influxdb
Gpu monitor
Monitor your GPUs whether they are on a single computer or in a cluster
Stars: ✭ 133 (-45.71%)
Mutual labels:  influxdb
Pfsense Dashboard
A functional and useful dashboard for pfSense that utilizes influxdb, grafana and telegraf
Stars: ✭ 208 (-15.1%)
Mutual labels:  influxdb
Influxdb exporter
A server that accepts InfluxDB metrics via the HTTP API and exports them via HTTP for Prometheus consumption
Stars: ✭ 159 (-35.1%)
Mutual labels:  influxdb
Influxdb Client For Arduino
Simple library for sending measurements to an InfluxDB with a single network request. Supports ESP8266 and ESP32.
Stars: ✭ 176 (-28.16%)
Mutual labels:  influxdb
Influxdata.net
InfluxData TICK stack .net library.
Stars: ✭ 142 (-42.04%)
Mutual labels:  influxdb
Ohmgraphite
Export Open Hardware sensor data to Graphite / InfluxDB / Prometheus / Postgres / Timescaledb
Stars: ✭ 155 (-36.73%)
Mutual labels:  influxdb
Frostmourne
frostmourne是基于Elasticsearch, InfluxDB数据,Mysql数据的监控,报警,分析系统. Monitor & alert & alarm & analyze for Elasticsearch && InfluxDB Log Data。主要使用springboot2 + vue-element-admin。 https://frostmourne-demo.github.io/
Stars: ✭ 166 (-32.24%)
Mutual labels:  influxdb
Node Opcua Logger
An OPCUA Client for logging data to InfluxDB! 🔌 🏭
Stars: ✭ 138 (-43.67%)
Mutual labels:  influxdb
Pi Hole Monitoring
Monitoring Pi-Hole statistics with Grafana
Stars: ✭ 196 (-20%)
Mutual labels:  influxdb
Go Recipes
Code examples for the book "Go Recipes" by Apress.
Stars: ✭ 135 (-44.9%)
Mutual labels:  influxdb
Pifpaf
Python fixtures and daemon managing tools for functional testing
Stars: ✭ 161 (-34.29%)
Mutual labels:  influxdb
Snmpcollector
A full featured Generic SNMP data collector with Web Administration Interface for InfluxDB
Stars: ✭ 216 (-11.84%)
Mutual labels:  influxdb
Kafka Influxdb
High performance Kafka consumer for InfluxDB. Supports collectd message formats.
Stars: ✭ 206 (-15.92%)
Mutual labels:  influxdb
Influxdb Client Python
InfluxDB 2.0 python client
Stars: ✭ 165 (-32.65%)
Mutual labels:  influxdb

go-runtime-metrics

Collect golang runtime metrics, pushing to InfluxDB or pulling with Telegraf. Inspired by https://github.com/bmhatfield/go-runtime-metrics

Installation

go get -u github.com/tevjef/go-runtime-metrics

Push Usage

This library can be configured to push metrics directly to InfluxDB.

import (
	metrics "github.com/tevjef/go-runtime-metrics"
)

func main() {
	err := metrics.RunCollector(metrics.DefaultConfig)
	
	if err != nil {
	   // handle error
	}
}
	

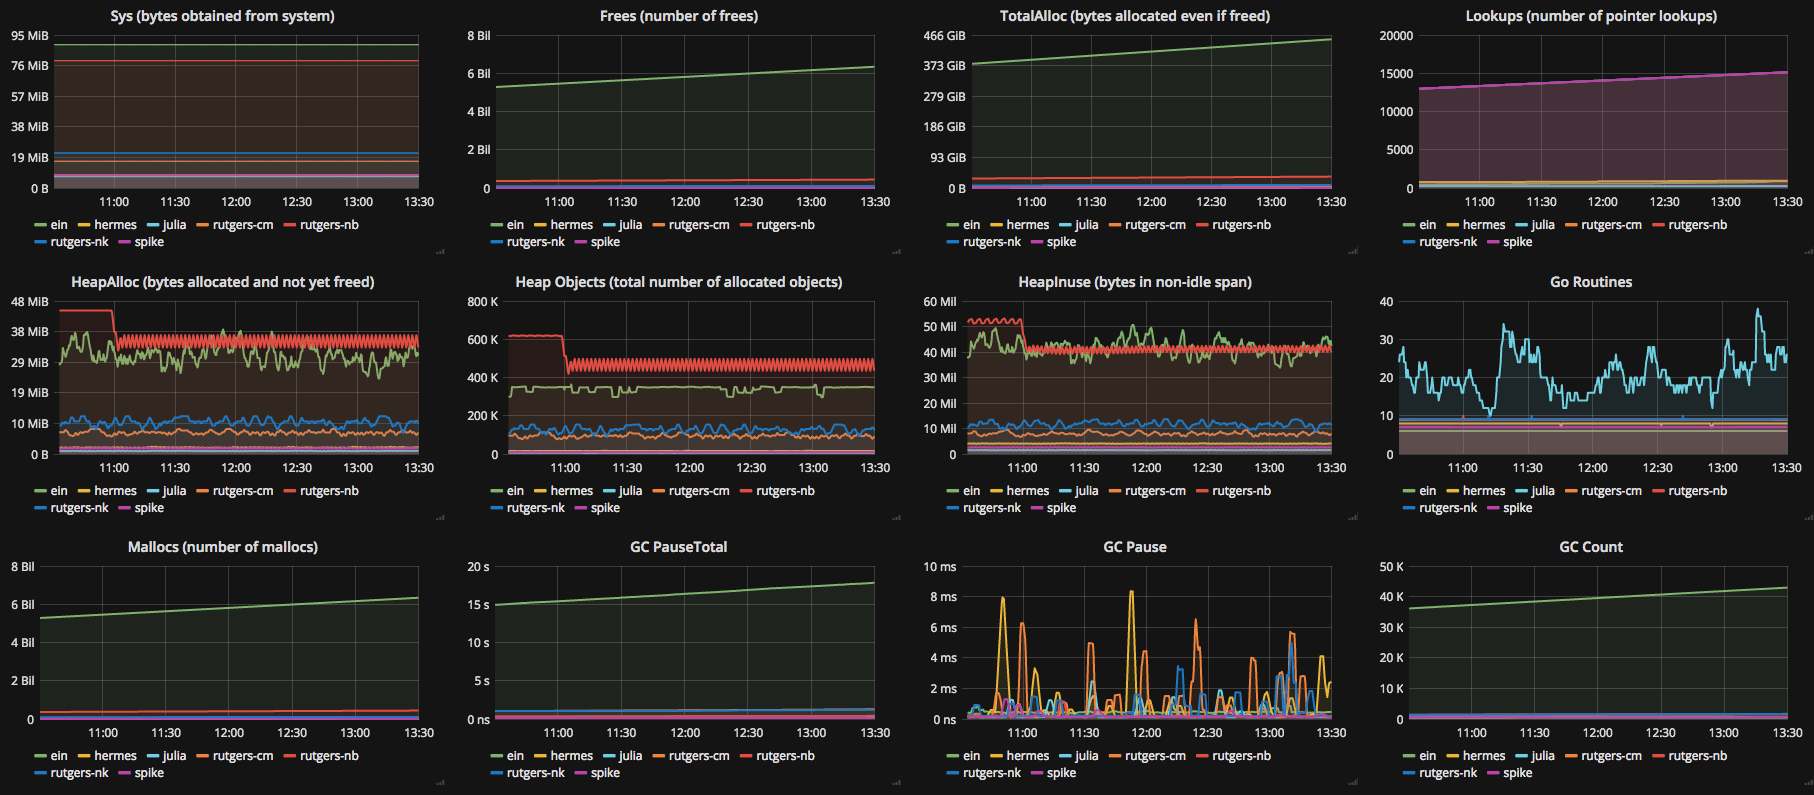
Once imported and running, you can expect a number of Go runtime metrics to be sent to InfluxDB. An example of what this looks like when configured to work with Grafana:

Download Dashboard

Pull Usage via expvar

Package expvar provides a standardized interface to public variables. This library provides an exported InfluxDB formatted variable with a few other benefits:

  • Metric names are easily parsed by regexp.
  • Lighter than the standard library memstat expvar
  • Includes stats for cpu.cgo_calls, cpu.goroutines and timing of the last GC pause with mem.gc.pause.
  • Works out the box with Telegraf's InfluxDB input plugin

Import this library's expvar package with import _ "github.com/tevjef/go-runtime-metrics/expvar" to export a variable with default configurations.

{
  "/go/bin/binary": {
    "name": "go_runtime_metrics",
    "tags": {
      "go.arch": "amd64",
      "go.os": "darwin",
      "go.version": "go1.7.4"
    },
    "values": {
      "cpu.count": 4,
      "cpu.cgo_calls": 1,
      "cpu.goroutines": 2,
      "mem.alloc": 667576,
      "mem.frees": 104,
      "mem.gc.count": 0,
      "mem.gc.last": 0,
      "mem.gc.next": 4194304,
      "mem.gc.pause": 0,
      "mem.gc.pause_total": 0,
      "mem.gc.sys": 65536,
      "mem.heap.alloc": 667576,
      "mem.heap.idle": 475136,
      "mem.heap.inuse": 1327104,
      "mem.heap.objects": 5227,
      "mem.heap.released": 0,
      "mem.heap.sys": 1802240,
      "mem.lookups": 3,
      "mem.malloc": 5331,
      "mem.othersys": 820558,
      "mem.stack.inuse": 294912,
      "mem.stack.mcache_inuse": 4800,
      "mem.stack.mcache_sys": 16384,
      "mem.stack.mspan_inuse": 14160,
      "mem.stack.mspan_sys": 16384,
      "mem.stack.sys": 294912,
      "mem.sys": 3018752,
      "mem.total": 667576
    }
  }
}

Configuring with Telegraf

Your program must import _ "github.com/tevjef/go-runtime-metrics/expvar in order for an InfluxDB formatted variable to be exported via /debug/vars.

  1. Install Telegraf

  2. Make a config file utilizing the influxdb input plugin and an output plugin of your choice.

    [[inputs.influxdb]]
      urls = ["http://localhost:6060/debug/vars"]
    
    [[outputs.influxdb]]
      urls = ["http://localhost:8086"]
      ## The target database for metrics (telegraf will create it if not exists).
      database = "stats" # required
      
    ## [[outputs.file]]
    ##   files = ["stdout"]
    ##   data_format = "json"
    
  3. Start the Telegraf agent with telegraf -config config.conf

Benchmarks

Benchmark against standard library memstat expvar:

$ go test -bench=. -parallel 16 -cpu 1,2,4

BenchmarkMetrics          100000             12456 ns/op            4226 B/op         21 allocs/op
BenchmarkMetrics-2         20000             63597 ns/op            4264 B/op         21 allocs/op
BenchmarkMetrics-4         50000             28797 ns/op            4266 B/op         21 allocs/op
BenchmarkMemstat           20000             78009 ns/op           52264 B/op         12 allocs/op
BenchmarkMemstat-2         10000            155930 ns/op           52264 B/op         12 allocs/op
BenchmarkMemstat-4         10000            144849 ns/op           52266 B/op         12 allocs/op

  System Info: 

  Processor Name:	Intel Core i5
  Processor Speed:	3.5 GHz
  Number of Processors:	1
  Total Number of Cores:	4
  L2 Cache (per Core):	256 KB
  L3 Cache:	6 MB
  Memory:	32 GB
  Bus Speed:	400 MHz

Note that the project description data, including the texts, logos, images, and/or trademarks, for each open source project belongs to its rightful owner. If you wish to add or remove any projects, please contact us at [email protected].