All Projects â†’ briandconnelly â†’ Growthcurve

briandconnelly / Growthcurve

Licence: other
📈R package for analyzing biological growth

Programming Languages

r
7636 projects

Labels

Projects that are alternatives of or similar to Growthcurve

FALDO
Feature Annotation Location Description Ontology
Stars: ✭ 28 (+460%)
Mutual labels:  biology
worrms
World Register of Marine Species R client
Stars: ✭ 13 (+160%)
Mutual labels:  biology
Jbrowse
A modern genome browser built with JavaScript and HTML5.
Stars: ✭ 393 (+7760%)
Mutual labels:  biology
full spectrum bioinformatics
An open-access bioinformatics text
Stars: ✭ 26 (+420%)
Mutual labels:  biology
cellcount
A Convolutional Neural Network for Segmenting and Counting Cells in Microscopy Images
Stars: ✭ 51 (+920%)
Mutual labels:  biology
Pygeno
Personalized Genomics and Proteomics. Main diet: Ensembl, side dishes: SNPs
Stars: ✭ 261 (+5120%)
Mutual labels:  biology
platetools
An R package for plotting microtitre plates
Stars: ✭ 45 (+800%)
Mutual labels:  biology
Dna 3d Engine
3d engine implementation in DNA code!
Stars: ✭ 493 (+9760%)
Mutual labels:  biology
lexicon-mono-seq
DOM Text Based Multiple Sequence Alignment Library
Stars: ✭ 15 (+200%)
Mutual labels:  biology
Jvarkit
Java utilities for Bioinformatics
Stars: ✭ 313 (+6160%)
Mutual labels:  biology
flexidot
Highly customizable, ambiguity-aware dotplots for visual sequence analyses
Stars: ✭ 73 (+1360%)
Mutual labels:  biology
chemicalx
A PyTorch and TorchDrug based deep learning library for drug pair scoring.
Stars: ✭ 176 (+3420%)
Mutual labels:  biology
Deepchem
Democratizing Deep-Learning for Drug Discovery, Quantum Chemistry, Materials Science and Biology
Stars: ✭ 3,324 (+66380%)
Mutual labels:  biology
aquarium
The Aquarium Lab Operating System
Stars: ✭ 44 (+780%)
Mutual labels:  biology
Biojs
🔎A library of JavaScript components to represent biological data
Stars: ✭ 438 (+8660%)
Mutual labels:  biology
python-bioimage-analysis-tutorial
The new and improved 2018 version of the EMBL Python BioImage Analysis Tutorial. Now finally in python 3!
Stars: ✭ 41 (+720%)
Mutual labels:  biology
Bio.jl
[DEPRECATED] Bioinformatics and Computational Biology Infrastructure for Julia
Stars: ✭ 257 (+5040%)
Mutual labels:  biology
Ncbi Genome Download
Scripts to download genomes from the NCBI FTP servers
Stars: ✭ 494 (+9780%)
Mutual labels:  biology
Chainer Chemistry
Chainer Chemistry: A Library for Deep Learning in Biology and Chemistry
Stars: ✭ 462 (+9140%)
Mutual labels:  biology
Tdc
Therapeutics Data Commons: Machine Learning Datasets and Tasks for Therapeutics
Stars: ✭ 291 (+5720%)
Mutual labels:  biology

growthcurve: Analysis of Biological Growth

Project Status: Abandoned – Initial development has started, but there has not yet been a stable, usable release; the project has been abandoned and the author(s) do not intend on continuing development. BSD License Travis-CI Build Status CRAN_Status_Badge

The growthcurve package provides tools for analyzing biological growth, or "growth curves" in R. It is designed to integrate into modern workflows based around "tidy data", allowing it to be used in conjunction with other tools. growthcurve also provides wrappers that allow tidy growth data to be analyzed using the popular, but no-longer-maintained grofit package, if installed.

Installation

growthcurve is not quite ready to be available on CRAN, but you can use devtools to install the current development version:

    if(!require("devtools")) install.packages("devtools")
    devtools::install_github("briandconnelly/growthcurve", build_vignettes = TRUE)

Fitting Growth Curves

growthcurve's most important function is fit_growth, which fits a growth curve to the given data. Here, we'll fit a growth curve to one replicate population from the included pseudomonas data set, which has columns Time and CFUmL:

library(dplyr)
library(growthcurve)

rep1 <- filter(pseudomonas, Replicate == 1 & Strain == "PAO1")
myfit <- fit_growth(rep1, Time, CFUmL)

Even better, we can do this all at once with pipes:

myfit <- pseudomonas %>%
    filter(Replicate == 1 & Strain == "PAO1") %>%
    fit_growth(Time, CFUmL)

By default, fit_growth will fit a logistic curve, however the model argument can be used to specify a different model type. Here, we'll use a Gompertz function:

library(dplyr)
library(growthcurve)

rep1 <- filter(pseudomonas, Replicate == 1 & Strain == "PAO1")
myfit <- fit_growth(rep1, Time, CFUmL, model = "gompertz")

Other options include logistic4p, linear, loess, and spline. Additionally, grofit_logistic, grofit_gompertz, grofit_gompertz.exp, grofit_richards, and grofit_spline can be used to provide compatability with legacy scripts that use grofit. There's also a grofit_parametric, which finds the best among grofit's parametric models.

Interpreting Results

coming soon!

Visualizing Growth Curves

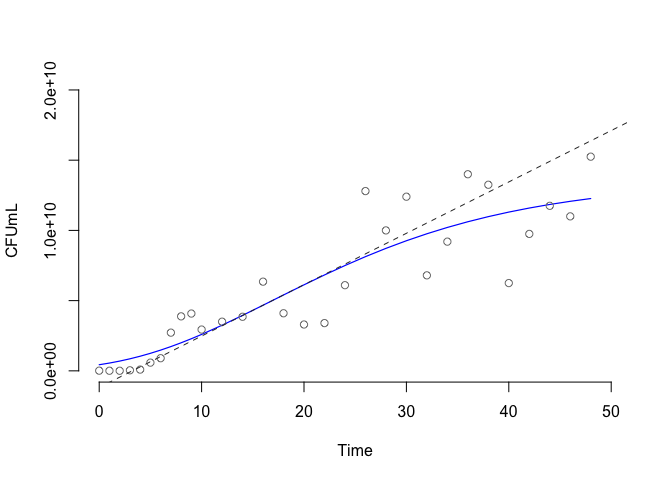
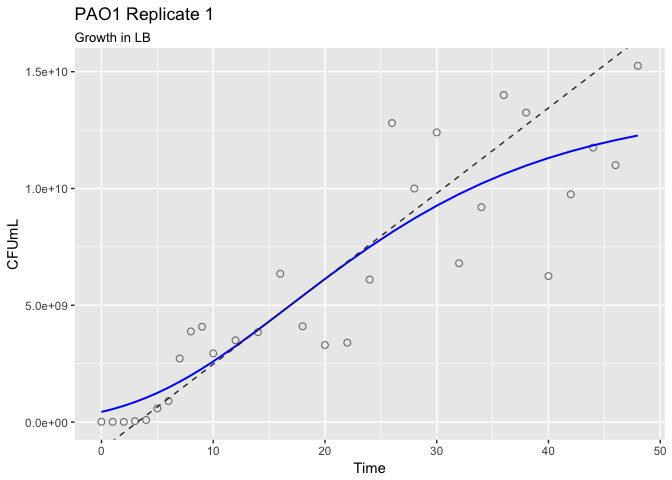
growthcurve includes tools for visualizing growth curves using either R's base graphics or ggplot2.

plot(myfit, show_raw = TRUE, show_maxrate = TRUE, show_asymptote = FALSE)

library(ggplot2)

autoplot(myfit, title = "PAO1 Replicate 1", subtitle = "Growth in LB")

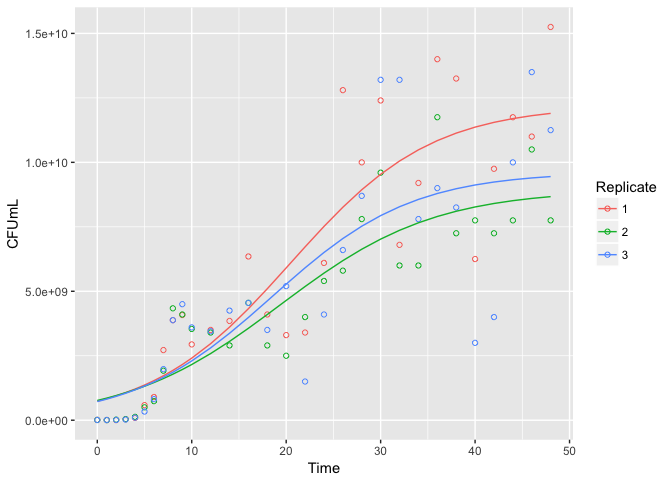
Alternatively, we can add growth curves to a ggplot2 plot with stat_growthcurve:

pao1data <- filter(pseudomonas, Strain == "PAO1")
ggplot(data = pao1data, aes(x = Time, y = CFUmL, color = Replicate)) +
    geom_point(shape = 1) +
    stat_growthcurve()

Code of Conduct

This project is released with a Contributor Code of Conduct. By participating in this project, you agree to abide by its terms.

License

growthcurve is released under the Simplified BSD License.

Note that the project description data, including the texts, logos, images, and/or trademarks, for each open source project belongs to its rightful owner. If you wish to add or remove any projects, please contact us at [email protected].