GuangchuangYu / Hexsticker
Programming Languages
Projects that are alternatives of or similar to Hexsticker
hexSticker: create hexagon sticker in R
✍️ Author
Guangchuang YU https://guangchuangyu.github.io
School of Basic Medical Sciences, Southern Medical University
⏬ Installation
Install the hexSticker package via CRAN:
install.packages("hexSticker")
You can also install the package via the Github repository.
# install.package("remotes")   #In case you have not installed it.
remotes::install_github("GuangchuangYu/hexSticker")
Fail to install
imageMagick
imageMagick is required for installing hexSticker. If you have not
installed it, please try the following
approaches.
Fail to load ‘sysfonts’
In Mac OS, you may need to re-install sysfont to properly load it.
Be sure to install xquartz first.
brew update && brew install homebrew/cask/xquartz
Examples
stickerfunction will produce a file with dimension exactly for printing according to http://hexb.in/sticker.html
base plot
library(hexSticker)
s <- sticker(~plot(cars, cex=.5, cex.axis=.5, mgp=c(0,.3,0), xlab="", ylab=""),
          package="hexSticker", p_size=20, s_x=.8, s_y=.6, s_width=1.4, s_height=1.2,
          filename="inst/figures/baseplot.png")
The sticker() will generate a figure specified by the filename
parameter. The output of the sticker() function is a ggplot object,
e.g. the s variable in the above example. Print the object,
print(s), will display the image. However, the image may slightly
different from the created image file since the graphic device size are
different. To solve this issue, hexSticker package provides plot
function to preview sticker. Try plot(s) :).

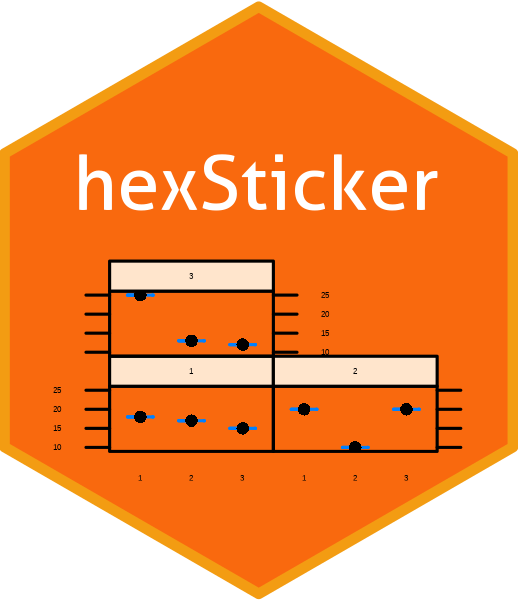
lattice
library(lattice)

counts <- c(18,17,15,20,10,20,25,13,12)
outcome <- gl(3,1,9)
treatment <- gl(3,3)
bwplot <- bwplot(counts ~ outcome | treatment, xlab=NULL, ylab=NULL, cex=.5,
                 scales=list(cex=.5), par.strip.text=list(cex=.5))
sticker(bwplot, package="hexSticker", p_size=20, s_x=1.05, s_y=.8, s_width=2, s_height=1.5,
        h_fill="#f9690e", h_color="#f39c12", filename="inst/figures/lattice.png")
ggplot2
library(ggplot2)

p <- ggplot(aes(x = mpg, y = wt), data = mtcars) + geom_point()
p <- p + theme_void() + theme_transparent()

sticker(p, package="hexSticker", p_size=20, s_x=1, s_y=.75, s_width=1.3, s_height=1,
        filename="inst/figures/ggplot2.png")

image file
imgurl <- system.file("figures/cat.png", package="hexSticker")
sticker(imgurl, package="hexSticker", p_size=20, s_x=1, s_y=.75, s_width=.6,
        filename="inst/figures/imgfile.png")

Google fonts
library(showtext)
## Loading Google fonts (http://www.google.com/fonts)
font_add_google("Gochi Hand", "gochi")
## Automatically use showtext to render text for future devices
showtext_auto()

## use the ggplot2 example
sticker(p, package="hexSticker", p_size=22, s_x=1, s_y=.75, s_width=1.3, s_height=1,
        p_family = "gochi", filename="inst/figures/ggplot2-google-font.png")

💖 Stickers produced by hexSticker
If you use
hexStickerand want your sticker to be listed here, please feel free to edit README.Rmd, and runrmarkdown::render("README.Rmd")inRto generateREADME.md.
Please put stickers in alphabet order.
Stickers for software packages
Stickers for events/workshops
Stickers for fun
Stickers for organizations
Print/order stickers
Sticker designers can make their stickers available via Sticker Mule.
Related Tools
- badger: Query information and generate badge for using in README and GitHub Pages.
- ggimage: Supports image files and graphic objects to be visualized in ‘ggplot2’ graphic system.
- meme: Create Meme.
- shadowtext: Create text grob with background shadow.


