All Projects → tommyod → Kdepy

tommyod / Kdepy

Licence: gpl-3.0
Kernel Density Estimation in Python

Programming Languages

python
139335 projects - #7 most used programming language
python3
1442 projects

Projects that are alternatives of or similar to Kdepy

Pandas Profiling
Create HTML profiling reports from pandas DataFrame objects
Stars: ✭ 8,329 (+3313.52%)
Mutual labels:  jupyter-notebook, statistics, data-analysis, exploratory-data-analysis
Datacamp
🍧 A repository that contains courses I have taken on DataCamp
Stars: ✭ 69 (-71.72%)
Mutual labels:  jupyter-notebook, statistics, data-analysis
Hyperlearn
50% faster, 50% less RAM Machine Learning. Numba rewritten Sklearn. SVD, NNMF, PCA, LinearReg, RidgeReg, Randomized, Truncated SVD/PCA, CSR Matrices all 50+% faster
Stars: ✭ 1,204 (+393.44%)
Mutual labels:  jupyter-notebook, statistics, data-analysis
Sweetviz
Visualize and compare datasets, target values and associations, with one line of code.
Stars: ✭ 1,851 (+658.61%)
Mutual labels:  statistics, data-analysis, exploratory-data-analysis
Bayesian Cognitive Modeling In Pymc3
PyMC3 codes of Lee and Wagenmakers' Bayesian Cognitive Modeling - A Pratical Course
Stars: ✭ 93 (-61.89%)
Mutual labels:  jupyter-notebook, statistics, data-analysis
Spark R Notebooks
R on Apache Spark (SparkR) tutorials for Big Data analysis and Machine Learning as IPython / Jupyter notebooks
Stars: ✭ 109 (-55.33%)
Mutual labels:  jupyter-notebook, data-analysis, exploratory-data-analysis
Covid19 Severity Prediction
Extensive and accessible COVID-19 data + forecasting for counties and hospitals. 📈
Stars: ✭ 170 (-30.33%)
Mutual labels:  jupyter-notebook, statistics, data-analysis
Choochoo
Training Diary
Stars: ✭ 186 (-23.77%)
Mutual labels:  jupyter-notebook, statistics
Dtale
Visualizer for pandas data structures
Stars: ✭ 2,864 (+1073.77%)
Mutual labels:  jupyter-notebook, data-analysis
Data Science Live Book
An open source book to learn data science, data analysis and machine learning, suitable for all ages!
Stars: ✭ 193 (-20.9%)
Mutual labels:  statistics, data-analysis
Morpheus Core
The foundational library of the Morpheus data science framework
Stars: ✭ 203 (-16.8%)
Mutual labels:  statistics, data-analysis
Collapse
Advanced and Fast Data Transformation in R
Stars: ✭ 184 (-24.59%)
Mutual labels:  statistics, data-analysis
Quant Notes
Quantitative Interview Preparation Guide, updated version here ==>
Stars: ✭ 180 (-26.23%)
Mutual labels:  jupyter-notebook, statistics
Virgilio
Virgilio is developed and maintained by these awesome people. You can email us virgilio.datascience (at) gmail.com or join the Discord chat.
Stars: ✭ 13,200 (+5309.84%)
Mutual labels:  jupyter-notebook, statistics
100 Days Of Ml Code
A day to day plan for this challenge. Covers both theoritical and practical aspects
Stars: ✭ 172 (-29.51%)
Mutual labels:  jupyter-notebook, exploratory-data-analysis
Geostatspy
GeostatsPy Python package for spatial data analytics and geostatistics. Mostly a reimplementation of GSLIB, Geostatistical Library (Deutsch and Journel, 1992) in Python. Geostatistics in a Python package. I hope this resources is helpful, Prof. Michael Pyrcz
Stars: ✭ 200 (-18.03%)
Mutual labels:  jupyter-notebook, statistics
Ditching Excel For Python
Functionalities in Excel translated to Python
Stars: ✭ 172 (-29.51%)
Mutual labels:  jupyter-notebook, exploratory-data-analysis
Imodels
Interpretable ML package 🔍 for concise, transparent, and accurate predictive modeling (sklearn-compatible).
Stars: ✭ 194 (-20.49%)
Mutual labels:  jupyter-notebook, statistics
Histogram
Fast multi-dimensional generalized histogram with convenient interface for C++14
Stars: ✭ 243 (-0.41%)
Mutual labels:  statistics, data-analysis
Datascienceprojects
The code repository for projects and tutorials in R and Python that covers a variety of topics in data visualization, statistics sports analytics and general application of probability theory.
Stars: ✭ 223 (-8.61%)
Mutual labels:  jupyter-notebook, statistics

DOI Build Status Documentation Status PyPI version Downloads

KDEpy

About

This Python 3.6+ package implements various kernel density estimators (KDE). Three algorithms are implemented through the same API: NaiveKDE, TreeKDE and FFTKDE. The class FFTKDE outperforms other popular implementations, see the comparison page. The code is stable and in widespread by practitioners and in other packages.

Plot

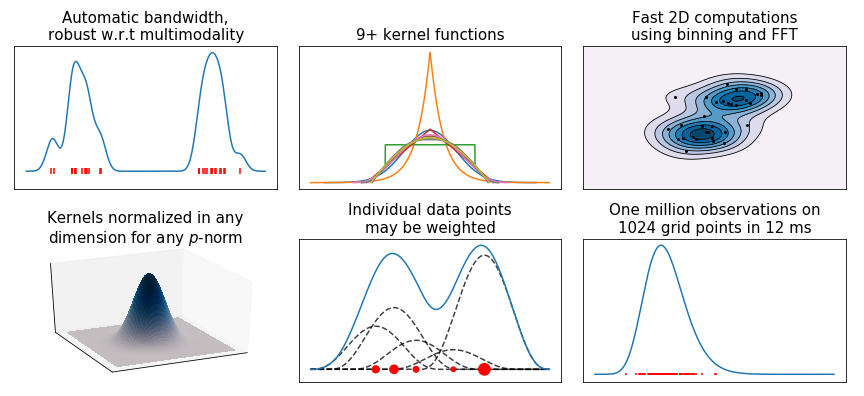
The code generating the above graph is found in examples.py.

Installation

KDEpy is available through PyPI, and may be installed using pip:

pip install KDEpy

If you have trouble on Ubuntu, try running sudo apt install libpython3.X-dev, where 3.X is your Python version.

Example code and documentation

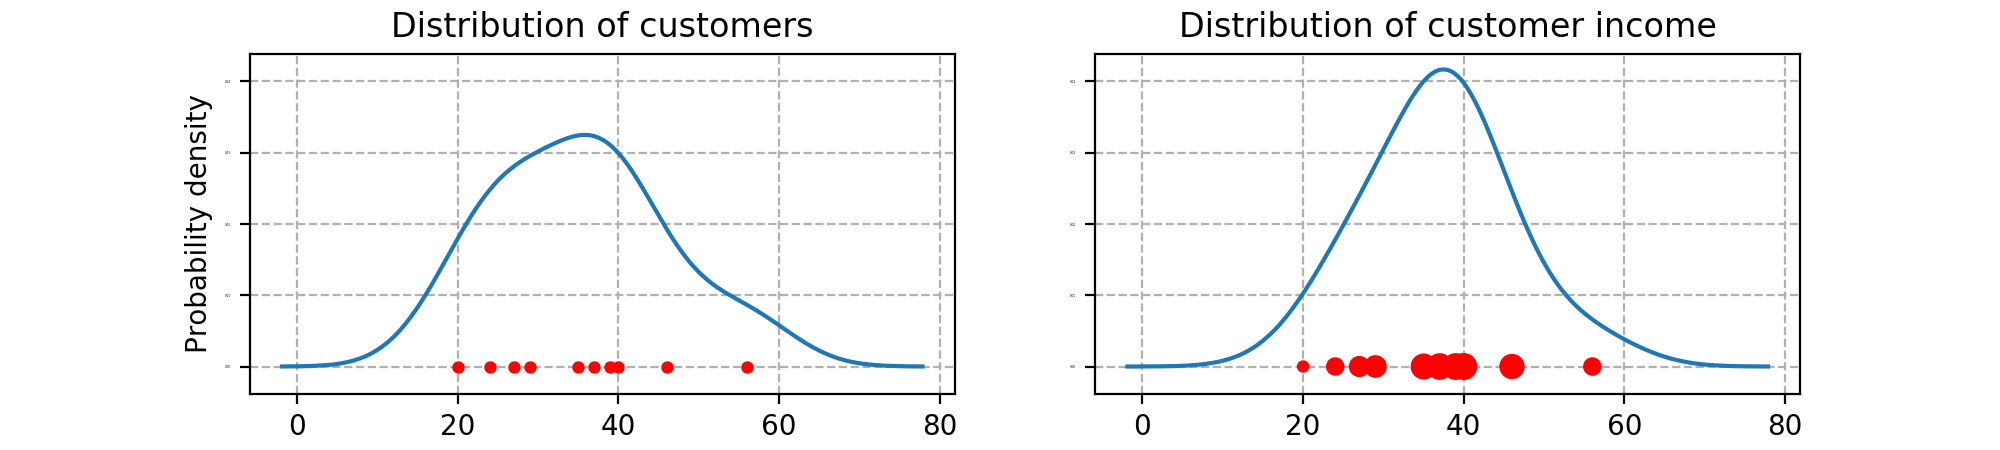
Below is an example showing an unweighted and weighted kernel density. From the code below, it should be clear how to set the kernel, bandwidth (variance of the kernel) and weights. See the documentation for more examples.

from KDEpy import FFTKDE
import matplotlib.pyplot as plt

customer_ages = [40, 56, 20, 35, 27, 24, 29, 37, 39, 46]

# Distribution of customers
x, y = FFTKDE(kernel="gaussian", bw="silverman").fit(customer_ages).evaluate()
plt.plot(x, y)

# Distribution of customer income (weight each customer by their income)
customer_income = [152, 64, 24, 140, 88, 64, 103, 148, 150, 132]

# The `bw` parameter can be manually set, e.g. `bw=5`
x, y = FFTKDE(bw="silverman").fit(customer_ages, weights=customer_income).evaluate()
plt.plot(x, y)

Plot

The package consists of three algorithms. Here's a brief explanation:

  • NaiveKDE - A naive computation. Supports d-dimensional data, variable bandwidth, weighted data and many kernel functions. Very slow on large data sets.
  • TreeKDE - A tree-based computation. Supports the same features as the naive algorithm, but is faster at the expense of small inaccuracy when using a kernel without finite support. Good for evaluation on non-uniform, arbitrary grids.
  • FFTKDE - A very fast convolution-based computation. Supports weighted d-dimensional data and many kernels, but not variable bandwidth. Must be evaluated on an equidistant grid, the finer the grid the higher the accuracy. Data points may not be outside of the grid.

Issues and contributing

Issues

If you are having trouble using the package, please let me know by creating an Issue on GitHub and I'll get back to you.

Contributing

Whatever your mathematical and Python background is, you are very welcome to contribute to KDEpy. To contribute, fork the project, create a branch and submit and Pull Request. Please follow these guidelines:

  • Import as few external dependencies as possible.
  • Use test driven development, have tests and docs for every method.
  • Cite literature and implement recent methods.
  • Unless it's a bottleneck computation, readability trumps speed.
  • Employ object orientation, but resist the temptation to implement many methods -- stick to the basics.
  • Follow PEP8.
Note that the project description data, including the texts, logos, images, and/or trademarks, for each open source project belongs to its rightful owner. If you wish to add or remove any projects, please contact us at [email protected].