akanz1 / Klib
Licence: mit
Easy to use Python library of customized functions for cleaning and analyzing data.
Stars: ✭ 192
Programming Languages
python
139335 projects - #7 most used programming language
Projects that are alternatives of or similar to Klib
Dat8
General Assembly's 2015 Data Science course in Washington, DC
Stars: ✭ 1,516 (+689.58%)
Mutual labels: data-science, data-analysis, data-cleaning, data-visualization
My Journey In The Data Science World
📢 Ready to learn or review your knowledge!
Stars: ✭ 1,175 (+511.98%)
Mutual labels: data-science, data-analysis, data-cleaning, data-visualization
Dtale
Visualizer for pandas data structures
Stars: ✭ 2,864 (+1391.67%)
Mutual labels: data-science, data-analysis, data-visualization
Seaborn Tutorial
This repository is my attempt to help Data Science aspirants gain necessary Data Visualization skills required to progress in their career. It includes all the types of plot offered by Seaborn, applied on random datasets.
Stars: ✭ 114 (-40.62%)
Mutual labels: data-science, data-analysis, data-visualization
Matplotplusplus
Matplot++: A C++ Graphics Library for Data Visualization 📊🗾
Stars: ✭ 2,433 (+1167.19%)
Mutual labels: data-science, data-analysis, data-visualization
Gradio
Create UIs for your machine learning model in Python in 3 minutes
Stars: ✭ 4,358 (+2169.79%)
Mutual labels: data-science, data-analysis, data-visualization
Superset
Apache Superset is a Data Visualization and Data Exploration Platform
Stars: ✭ 42,634 (+22105.21%)
Mutual labels: data-science, data-analysis, data-visualization
Pythondata
repo for code published on pythondata.com
Stars: ✭ 113 (-41.15%)
Mutual labels: data-science, data-analysis, data-visualization
Datasist
A Python library for easy data analysis, visualization, exploration and modeling
Stars: ✭ 123 (-35.94%)
Mutual labels: data-science, data-analysis, data-visualization
Awesome Scientific Python
A curated list of awesome scientific Python resources
Stars: ✭ 127 (-33.85%)
Mutual labels: data-science, data-analysis, data-visualization
Data Science Resources
👨🏽🏫You can learn about what data science is and why it's important in today's modern world. Are you interested in data science?🔋
Stars: ✭ 171 (-10.94%)
Mutual labels: data-science, data-analysis, data-visualization
Dex
Dex : The Data Explorer -- A data visualization tool written in Java/Groovy/JavaFX capable of powerful ETL and publishing web visualizations.
Stars: ✭ 1,238 (+544.79%)
Mutual labels: data-science, data-analysis, data-visualization
Data Science Portfolio
A Portfolio of my Data Science Projects
Stars: ✭ 149 (-22.4%)
Mutual labels: data-science, data-analysis, data-visualization
Sweetviz
Visualize and compare datasets, target values and associations, with one line of code.
Stars: ✭ 1,851 (+864.06%)
Mutual labels: data-science, data-analysis, data-visualization
Awesome Business Intelligence
Actively curated list of awesome BI tools. PRs welcome!
Stars: ✭ 1,157 (+502.6%)
Mutual labels: data-science, data-analysis, data-visualization
Graphia
A visualisation tool for the creation and analysis of graphs
Stars: ✭ 67 (-65.1%)
Mutual labels: data-science, data-analysis, data-visualization
Data Science Lunch And Learn
Resources for weekly Data Science Lunch & Learns
Stars: ✭ 49 (-74.48%)
Mutual labels: data-science, data-analysis, data-visualization
Openrefine
OpenRefine is a free, open source power tool for working with messy data and improving it
Stars: ✭ 8,531 (+4343.23%)
Mutual labels: data-science, data-analysis, data-visualization
Pandas Videos
Jupyter notebook and datasets from the pandas Q&A video series
Stars: ✭ 1,716 (+793.75%)
Mutual labels: data-science, data-analysis, data-cleaning
Dtale Desktop
Build a data visualization dashboard with simple snippets of python code
Stars: ✭ 128 (-33.33%)
Mutual labels: data-science, data-analysis, data-visualization
![]()


![]()
klib is a Python library for importing, cleaning, analyzing and preprocessing data. Explanations on key functionalities can be found on Medium / TowardsDataScience in the examples section or on YouTube (Data Professor).
Installation
Use the package manager pip to install klib.

pip install -U klib
Alternatively, to install this package with conda run:


conda install -c conda-forge klib
Usage
import klib
import pandas as pd
df = pd.DataFrame(data)
# klib.describe - functions for visualizing datasets
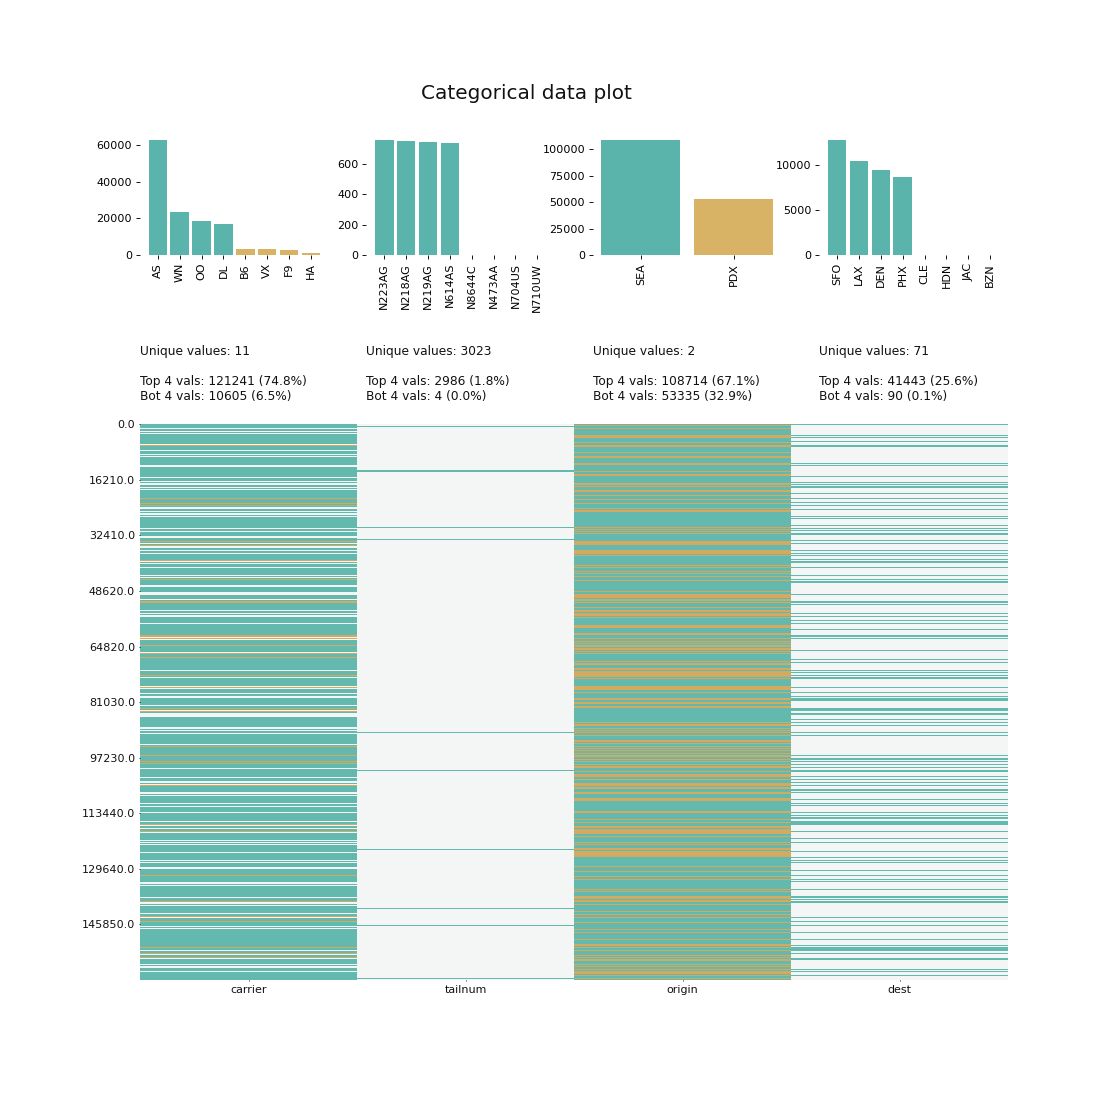
- klib.cat_plot(df) # returns a visualization of the number and frequency of categorical features
- klib.corr_mat(df) # returns a color-encoded correlation matrix
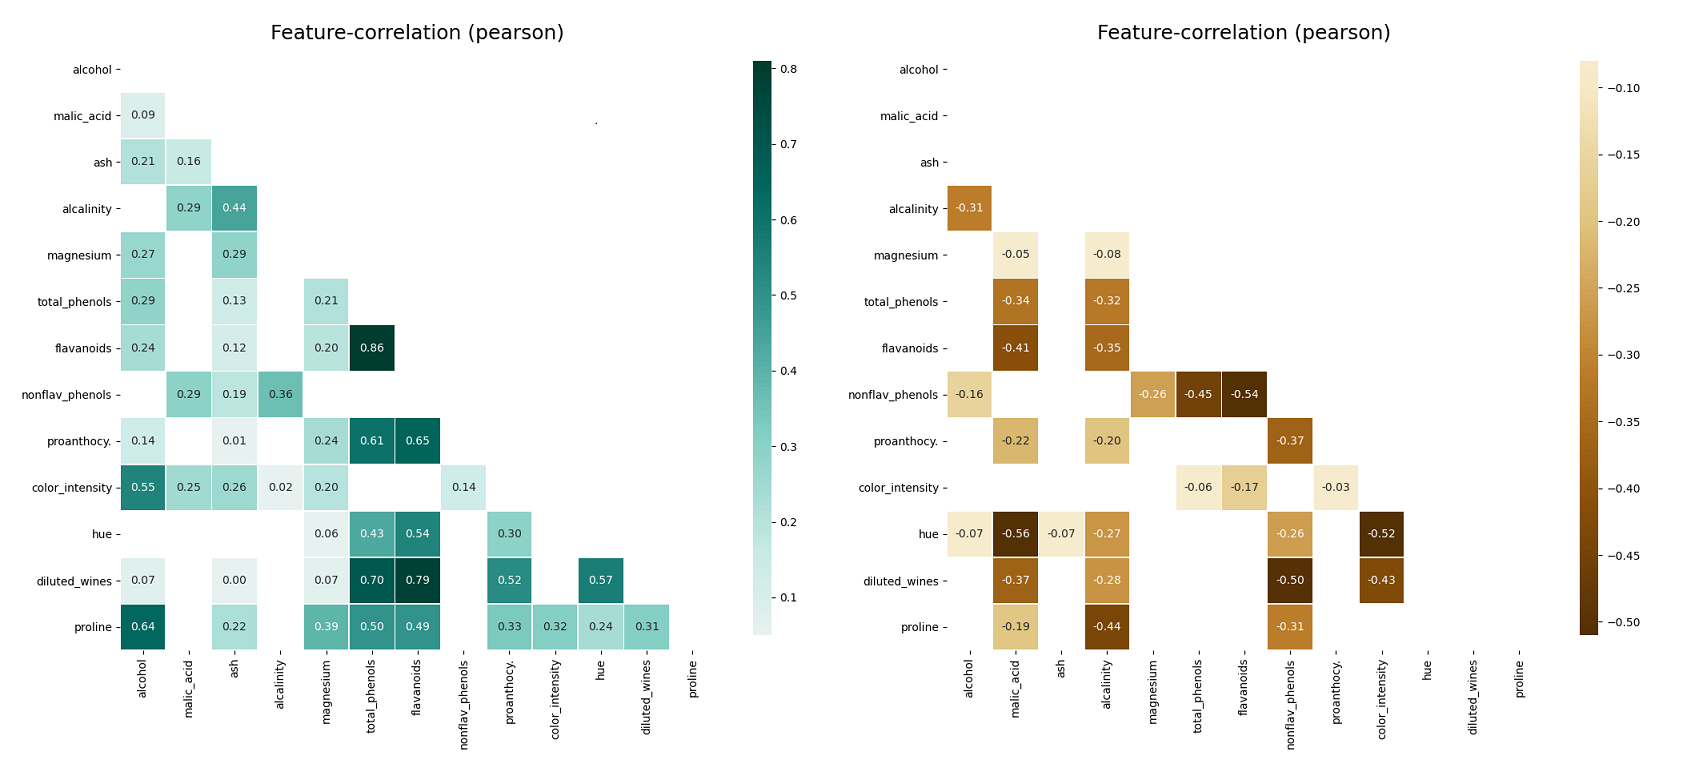
- klib.corr_plot(df) # returns a color-encoded heatmap, ideal for correlations
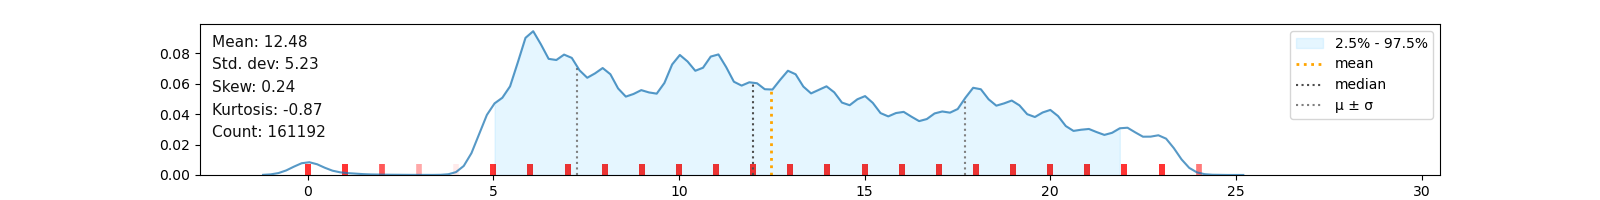
- klib.dist_plot(df) # returns a distribution plot for every numeric feature
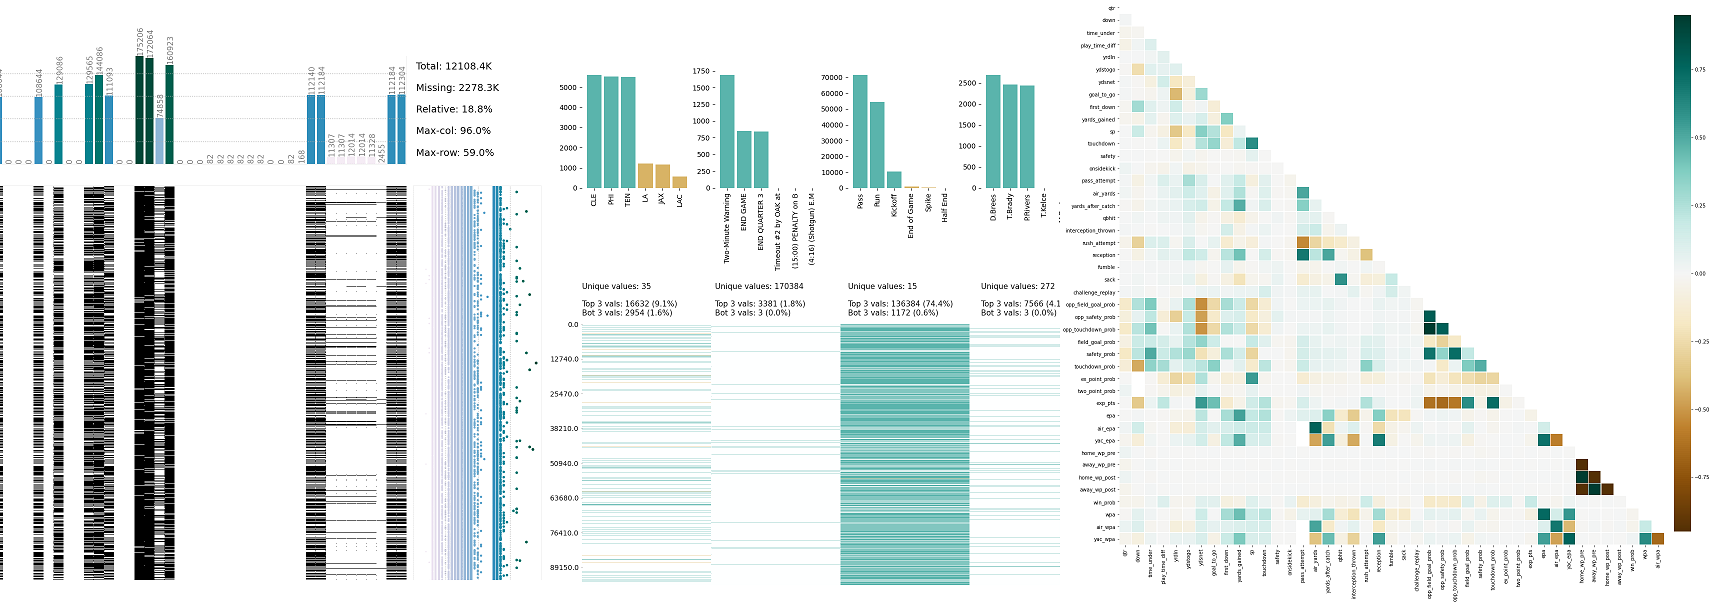
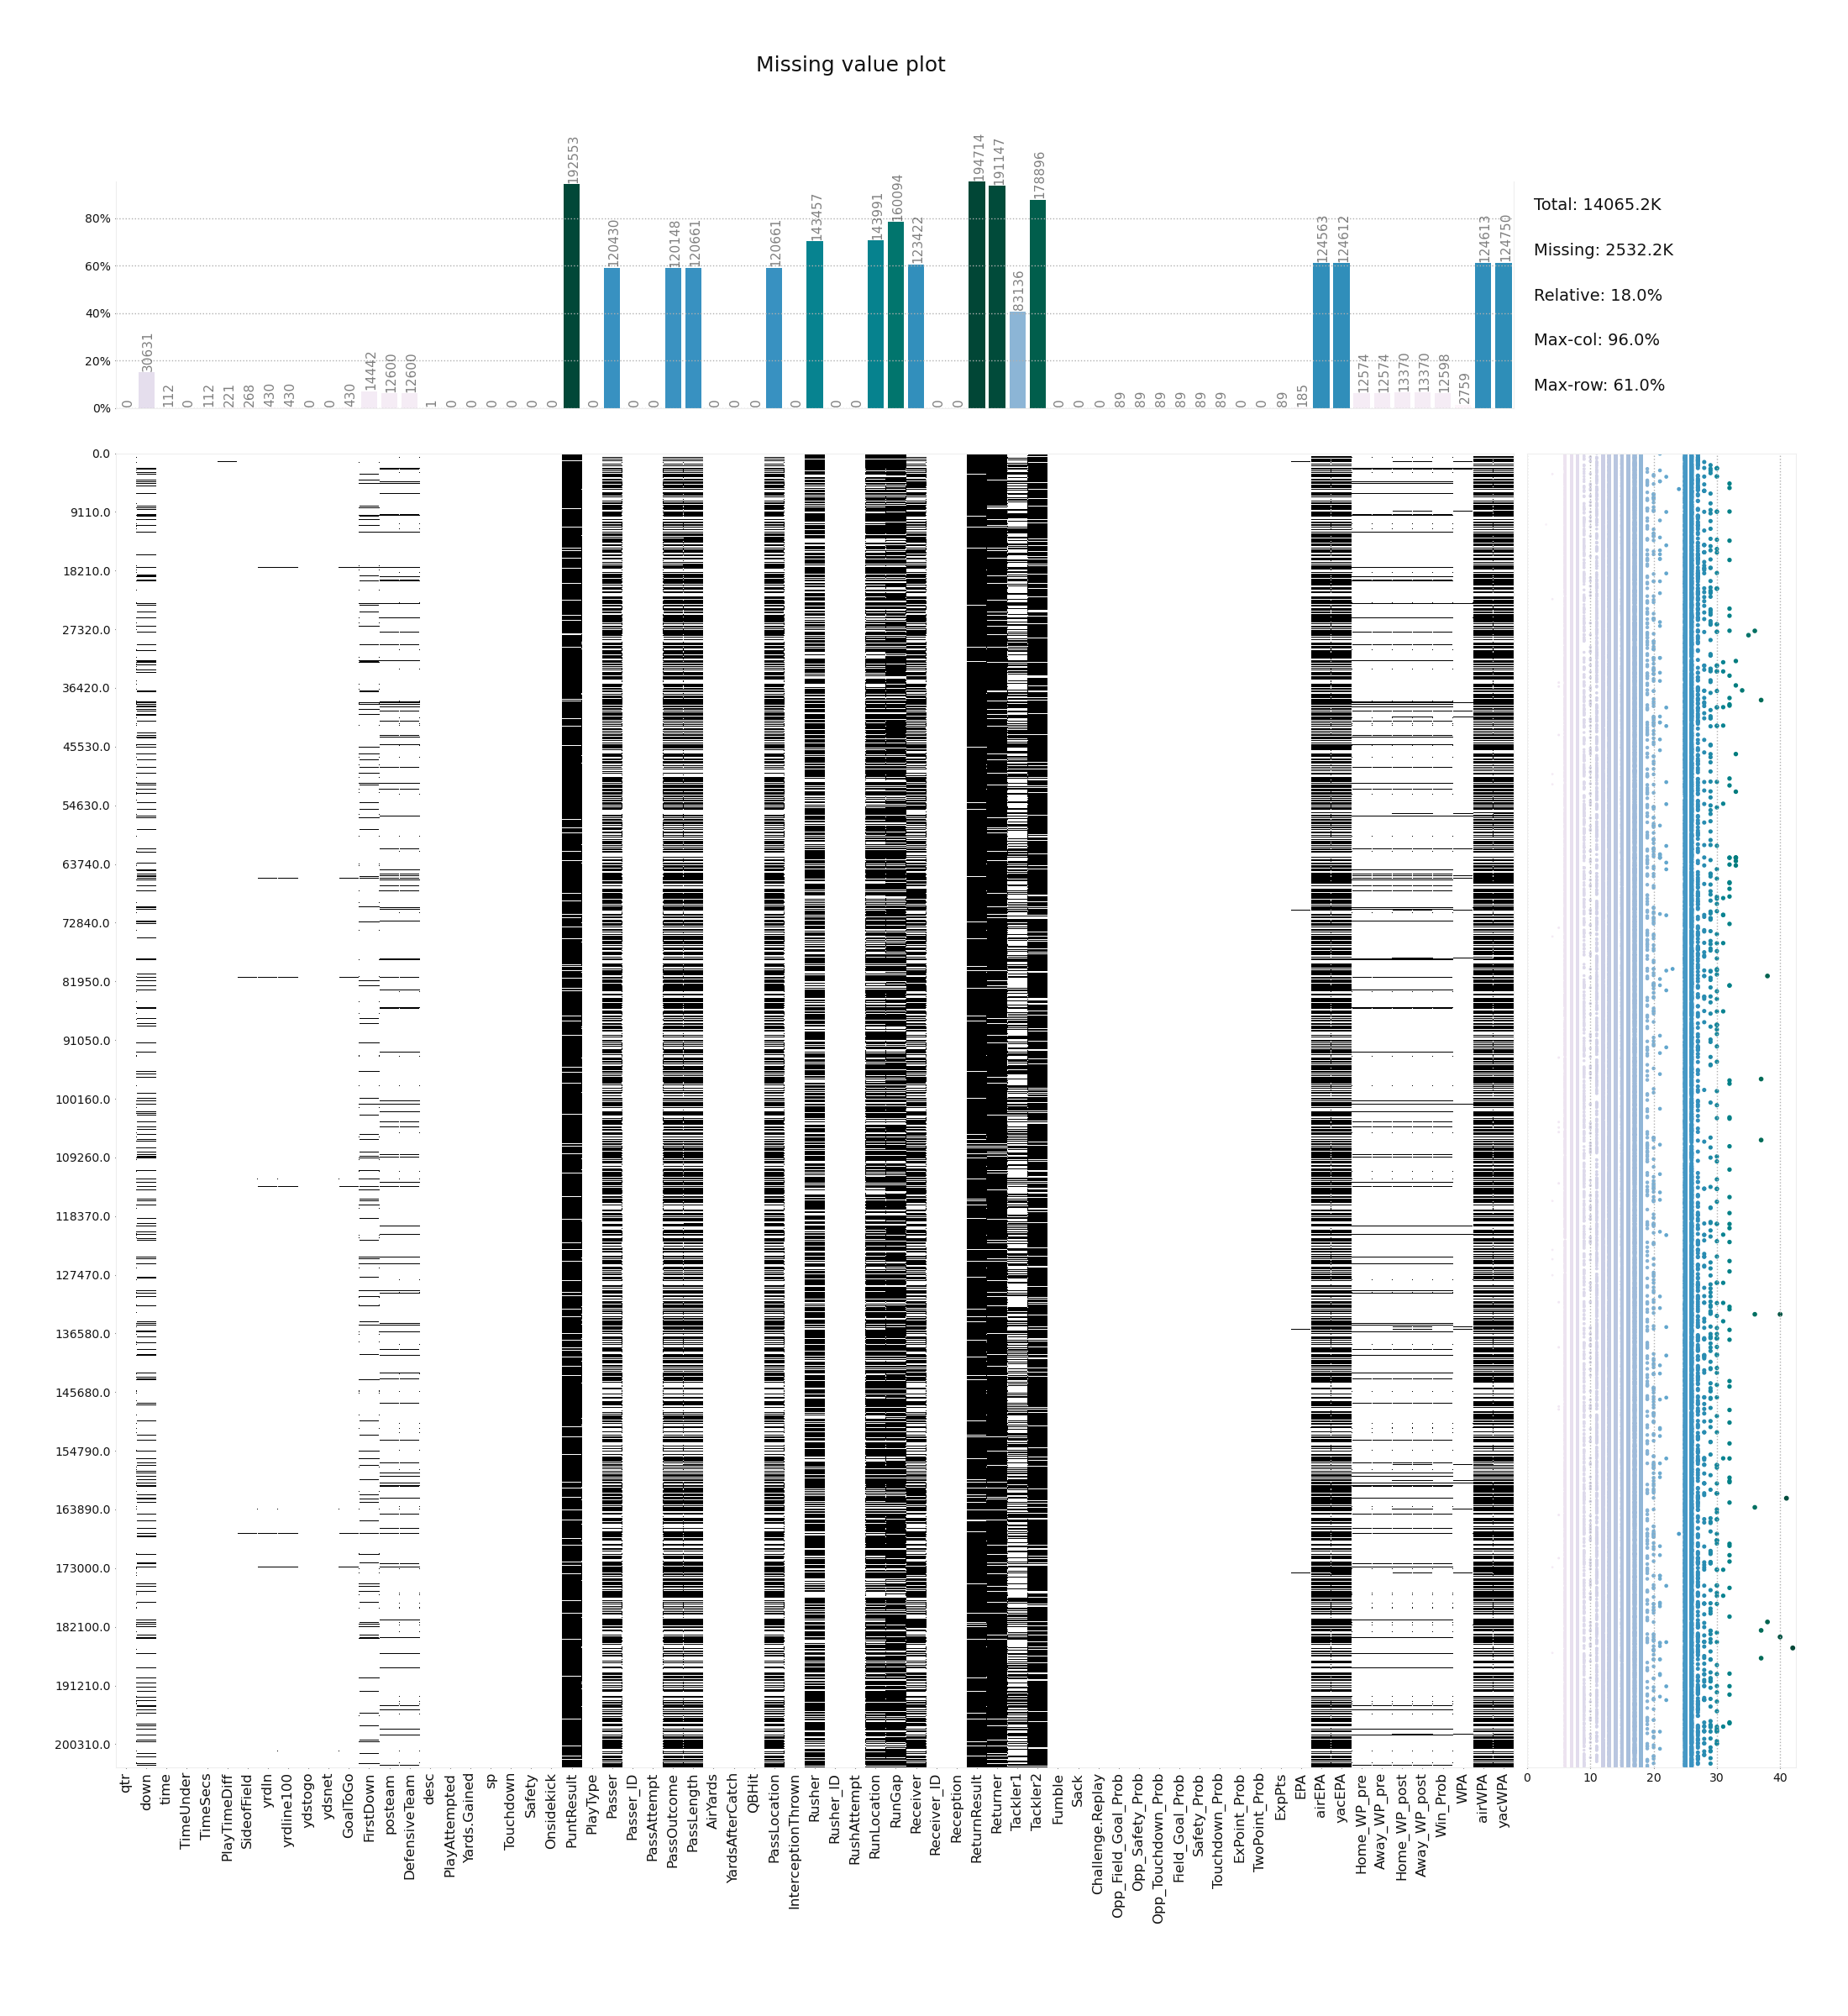
- klib.missingval_plot(df) # returns a figure containing information about missing values
# klib.clean - functions for cleaning datasets
- klib.data_cleaning(df) # performs datacleaning (drop duplicates & empty rows/cols, adjust dtypes,...)
- klib.clean_column_names(df) # cleans and standardizes column names, also called inside data_cleaning()
- klib.convert_datatypes(df) # converts existing to more efficient dtypes, also called inside data_cleaning()
- klib.drop_missing(df) # drops missing values, also called in data_cleaning()
- klib.mv_col_handling(df) # drops features with high ratio of missing vals based on informational content
- klib.pool_duplicate_subsets(df) # pools subset of cols based on duplicates with min. loss of information
# klib.preprocess - functions for data preprocessing (feature selection, scaling, ...)
- klib.train_dev_test_split(df) # splits a dataset and a label into train, optionally dev and test sets
- klib.feature_selection_pipe() # provides common operations for feature selection
- klib.num_pipe() # provides common operations for preprocessing of numerical data
- klib.cat_pipe() # provides common operations for preprocessing of categorical data
- klib.preprocess.ColumnSelector() # selects num or cat columns, ideal for a Feature Union or Pipeline
- klib.preprocess.PipeInfo() # prints out the shape of the data at the specified step of a Pipeline
Examples
Find all available examples as well as applications of the functions in klib.clean() with detailed descriptions here.
klib.missingval_plot(df) # default representation of missing values in a DataFrame, plenty of settings are available
klib.corr_plot(df, split='pos') # displaying only positive correlations, other settings include threshold, cmap...
klib.corr_plot(df, split='neg') # displaying only negative correlations
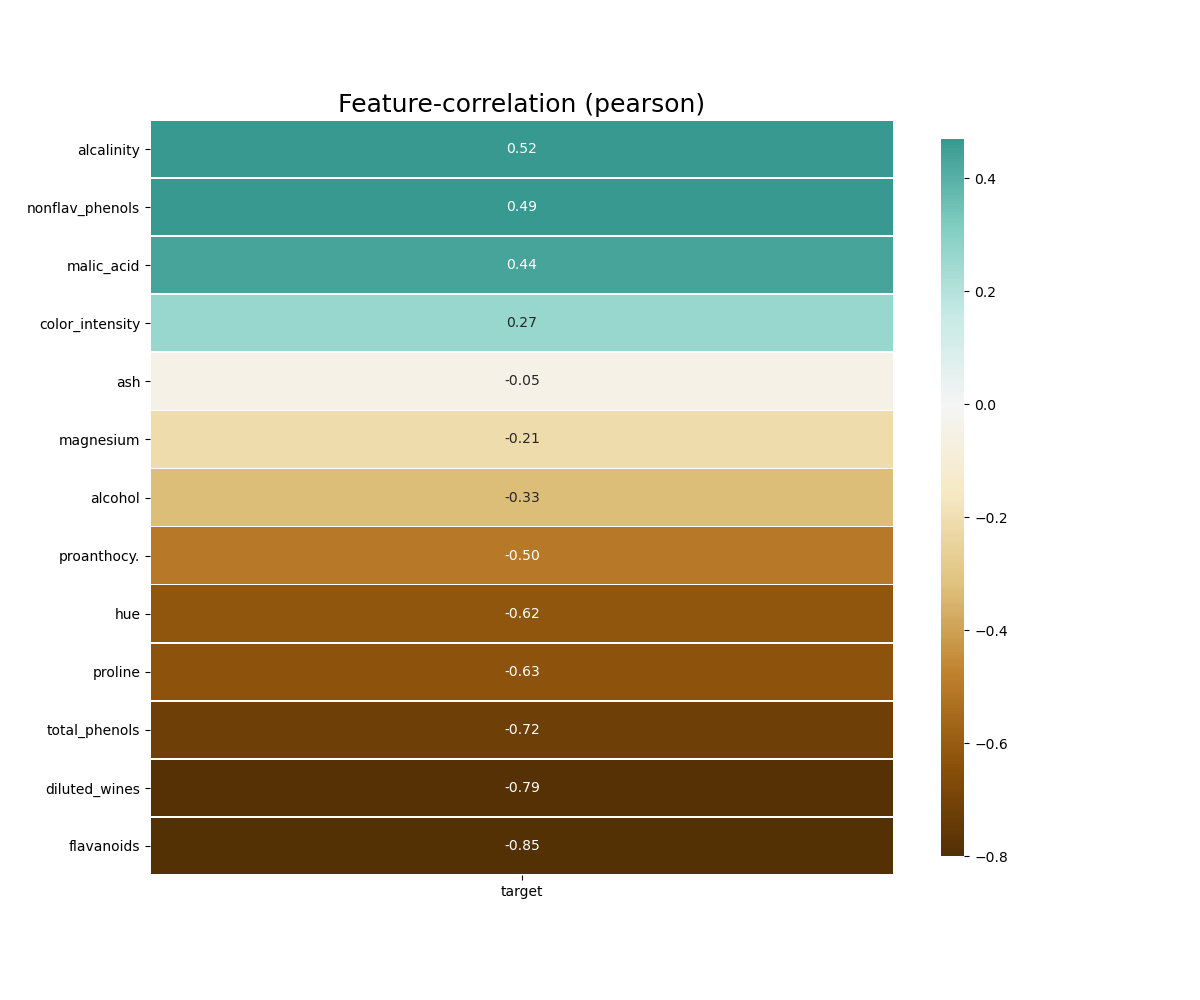
klib.corr_plot(df, target='wine') # default representation of correlations with the feature column
klib.dist_plot(df) # default representation of a distribution plot, other settings include fill_range, histogram, ...
klib.cat_plot(data, top=4, bottom=4) # representation of the 4 most & least common values in each categorical column
Further examples, as well as applications of the functions in klib.clean() can be found here.
Contributing
Pull requests and ideas, especially for further functions are welcome. For major changes or feedback, please open an issue first to discuss what you would like to change.
License
Note that the project description data, including the texts, logos, images, and/or trademarks,
for each open source project belongs to its rightful owner.
If you wish to add or remove any projects, please contact us at [email protected].