All Projects → ngfelixl → nodeplotlib

ngfelixl / nodeplotlib

Licence: MIT License
NodeJS plotting library for JavaScript and TypeScript. On top of plotly.js. Inspired by matplotlib.

Programming Languages

typescript
32286 projects
javascript
184084 projects - #8 most used programming language
HTML
75241 projects
SCSS
7915 projects
CSS
56736 projects

Projects that are alternatives of or similar to nodeplotlib

matplotlib-haskell
Haskell bindings for Python's Matplotlib
Stars: ✭ 80 (-30.43%)
Mutual labels:  charts, plot, matplotlib
mltb
Machine Learning Tool Box
Stars: ✭ 25 (-78.26%)
Mutual labels:  plot, matplotlib
SwiftCharts
Easy to use and highly customizable charts library for iOS
Stars: ✭ 2,405 (+1991.3%)
Mutual labels:  charts, plot
plotly-plot
Polymer element for the plotly.js library
Stars: ✭ 21 (-81.74%)
Mutual labels:  plotly, plot
heatmaps
Better heatmaps in Python
Stars: ✭ 117 (+1.74%)
Mutual labels:  plot, matplotlib
dash-lollapalooza-brasil-2018
🎟Using Plotly to visualize data from Lollapalooza
Stars: ✭ 23 (-80%)
Mutual labels:  charts, plotly
traceml
Engine for ML/Data tracking, visualization, dashboards, and model UI for Polyaxon.
Stars: ✭ 445 (+286.96%)
Mutual labels:  plotly, matplotlib
publib
Produce publication-level quality images on top of Matplotlib
Stars: ✭ 34 (-70.43%)
Mutual labels:  plot, matplotlib
reddit-hot-recorder
Records the activity (comments and karma) on the hot page of a Reddit sub and prepare an animated data visualisation.
Stars: ✭ 89 (-22.61%)
Mutual labels:  plot, matplotlib
Exploratory Data Analysis Visualization Python
Data analysis and visualization with PyData ecosystem: Pandas, Matplotlib Numpy, and Seaborn
Stars: ✭ 78 (-32.17%)
Mutual labels:  plotly, matplotlib
dashblocks-template
Dashblocks Vue Material Admin Template
Stars: ✭ 143 (+24.35%)
Mutual labels:  charts, plotly
bitrate-plotter
Plots a graph showing the bitrate every second or the bitrate of every GOP, for a video or audio file.
Stars: ✭ 15 (-86.96%)
Mutual labels:  plot, matplotlib
sarviewer
Generate graphs with gnuplot or matplotlib (Python) from sar data
Stars: ✭ 60 (-47.83%)
Mutual labels:  plot, matplotlib
python-data-visualization
Curated Python Notebooks for Data Visualization
Stars: ✭ 22 (-80.87%)
Mutual labels:  plotly, matplotlib
gaitutils
Extract and visualize gait data
Stars: ✭ 28 (-75.65%)
Mutual labels:  plotly, matplotlib
PandasVersusExcel
Python数据分析入门,数据分析师入门
Stars: ✭ 120 (+4.35%)
Mutual labels:  charts, matplotlib
Charts
⚡ Laravel Charts — Build charts using laravel. The laravel adapter for Chartisan.
Stars: ✭ 2,337 (+1932.17%)
Mutual labels:  charts, plot
Swiftcharts
Easy to use and highly customizable charts library for iOS
Stars: ✭ 2,336 (+1931.3%)
Mutual labels:  charts, plot
datatile
A library for managing, validating, summarizing, and visualizing data.
Stars: ✭ 419 (+264.35%)
Mutual labels:  plotly, matplotlib
Plotly.swift
Interactive data visualization library for Swift
Stars: ✭ 70 (-39.13%)
Mutual labels:  charts, plotly

NodePlotLib

NodeJS CI Coverage Status npm npm code style: prettier Gitter chat

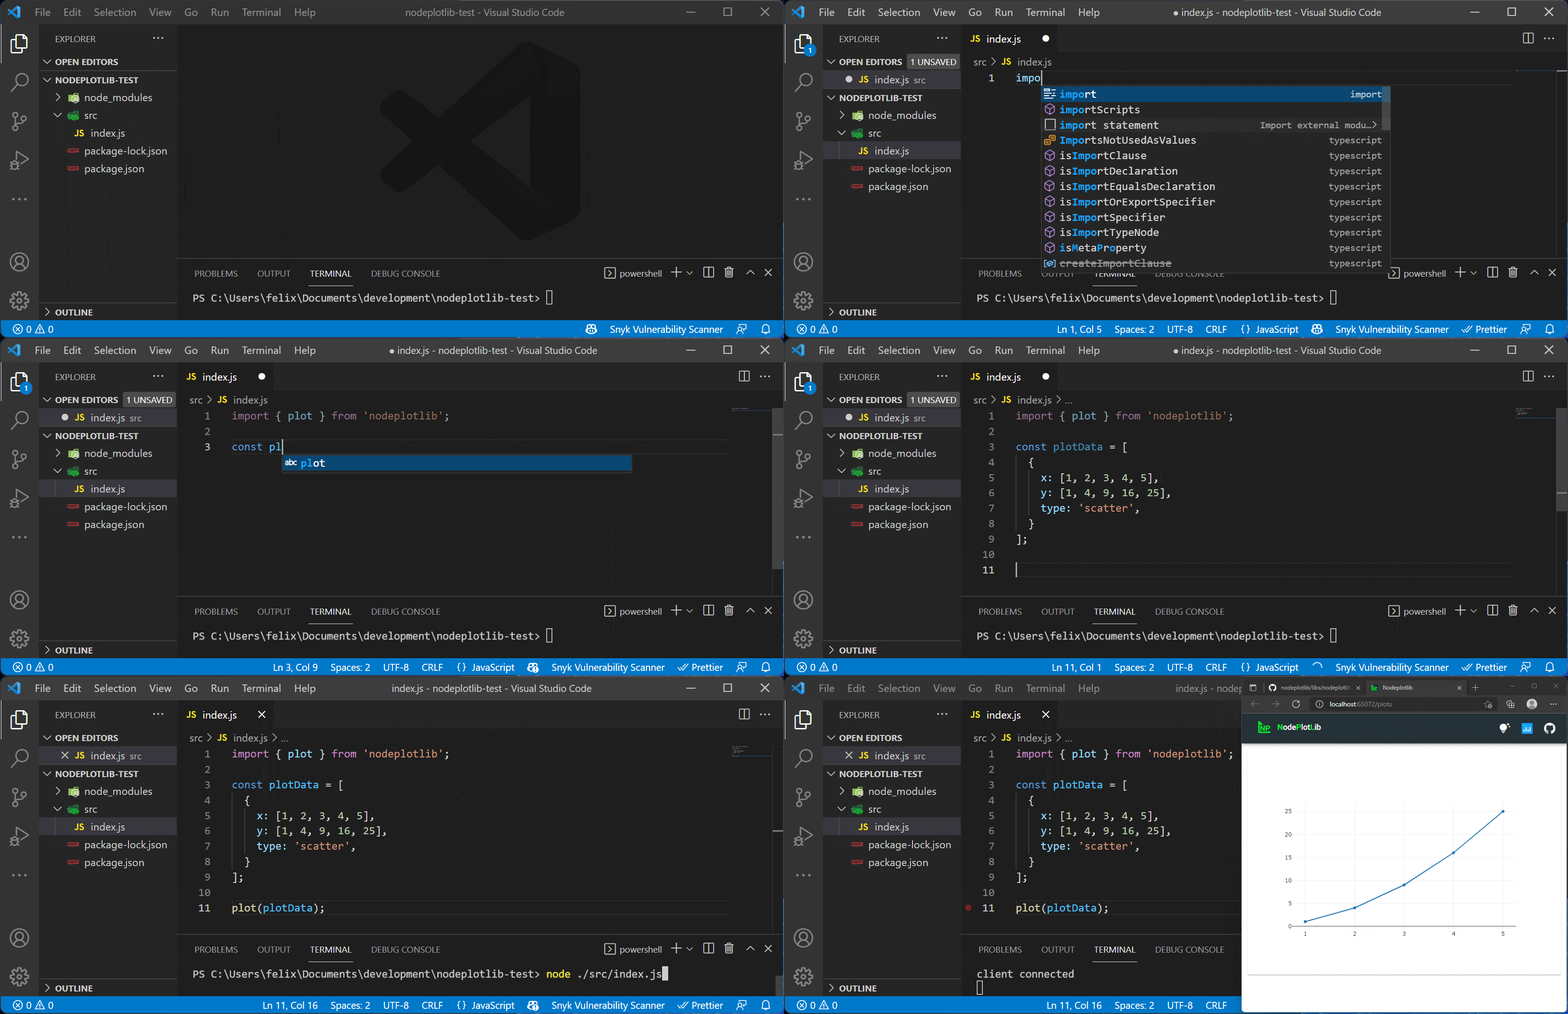
Animation (View on Github)

This readme contains all the necessary information for the development.

Go to the user docs

Installation

Npmjs

npm install nodeplotlib
# or
yarn add nodeplotlib

Repository

Create a fork of this repository. Then clone it

git clone https://github.com/{{USERNAME}}/nodeplotlib
cd nodeplotlib
npm i

Serving the app for development

Serving in development mode prevents the app to open a new browser window on changes. You can open the app at the specified port, e.g. http://localhost:4201.

npx nx run web:build -- --watch

NODEPLOTLIB_PORT=4201 npx nx run dev-server:serve
// or on Windows cmd
set "NODEPLOTLIB_PORT=4201" && npx nx run dev-server:serve
// or on Windows Powershell
$env:NODEPLOTLIB_PORT = "4201" ; npx nx run dev-server:serve

Build for production

To build for production three steps are necessary. Build the web app, build the library, and finally copy the web app files to the libraries dist folder. All steps are bundled in the following script:

npm run build:prod

All dist files are located in /dist/libs/nodeplotlib

Release Guide

This is a note for maintainers only. There are several steps to follow before you can publish the new version to npm.

  1. Bump the version number using semver. Use "rc" for release candidates as the preid, e.g. 1.0.0-rc1. Update the version number in the root package.json and in the libs package.json.
  2. If everything is committed and in place on "master" for non-release candidates, or on "release/..." for release candidates. Create a tag with that version number, e.g. v1.0.0-rc1 or v1.0.1, and push it to the repository.
  3. Run npm run build:prod
  4. Navigate to /dist/libs/nodeplotlib
  5. Run npm pack
  6. Make sure to be logged in to npmjs. Then run
    • npm publish {{filename}}.tgz or
    • npm publish {{filename}}.tgz --tag test for release candidates.
  7. Create a release on Github for non-release cadidate versions.

Behind the scenes

The lib launches a webserver and opens new tabs for every plot located at http://localhost:{{PORT}}, where PORT is a free port determined by the express server itself. At this address the Angular application will be served temporarily. The server and the app set up a connection via socket.io. This way a realtime transmission is possible.

Contributing

Contributions in all forms are welcome.

Contributors

Note that the project description data, including the texts, logos, images, and/or trademarks, for each open source project belongs to its rightful owner. If you wish to add or remove any projects, please contact us at [email protected].