kayrus / Prometheus Kubernetes
Programming Languages
Projects that are alternatives of or similar to Prometheus Kubernetes
See also Elasticsearch+Kibana Kubernetes complete example
Prerequisites
Kubectl
kubectl should be configured.
Namespace
This example uses monitoring namespace. If you wish to use your own namespace, just export NAMESPACE=mynamespace environment variable.
Upload etcd TLS keypair
In case when you use TLS keypair and TLS auth for your etcd cluster, please put corresponding TLS keypair into the etcd-tls-client-certs secrets:
kubectl --namespace=monitoring create secret generic --from-file=ca.pem=/path/to/ca.pem --from-file=client.pem=/path/to/client.pem --from-file=client-key.pem=/path/to/client-key.pem etcd-tls-client-certs
otherwise create a dummy secret:
kubectl --namespace=monitoring create secret generic --from-literal=ca.pem=123 --from-literal=client.pem=123 --from-literal=client-key.pem=123 etcd-tls-client-certs
Upload Ingress controller server TLS keypairs
In order to provide secure endpoint available trough the Internet you have to set example-tls secret inside the monitoring Kubernetes namespace.
kubectl create --namespace=monitoring secret tls example-tls --cert=cert.crt --key=key.key
Detailed information is available here. Ingress manifest example.
Create Ingress basic auth entry
With the internal-services-auth name. More info is here. Ingress manifest example.
Set proper external URLs to have correct links in notifications
Run EXTERNAL_URL=https://my-external-prometheus.example.com ./deploy.sh to deploy Prometheus monitoring configured to use https://my-external-prometheus.example.com base URL. Otherwise it will use default value: https://prometheus.example.com.
Assumptions
Disk mount points
This repo assumes that your Kubernetes worker nodes contain two observable mount points:
- root mount point
/which is mounted as readonly/root-diskinside thenode-exporterpod - data mount point
/localdatawhich is mounted as readonly/data-diskinside thenode-exporterpod
If you wish to change these values, you have to modify node-exporter-ds.yaml, prometheus-rules/low-disk-space.rules, grafana-import-dashboards-configmap and then rebuild configmap manifests before you run ./deploy.sh script.
Data storage
This repo uses emptyDir data storage which means that every pod restart will cause data loss. In case when you wish to use persistant storage please modify the following manifests correspondingly:
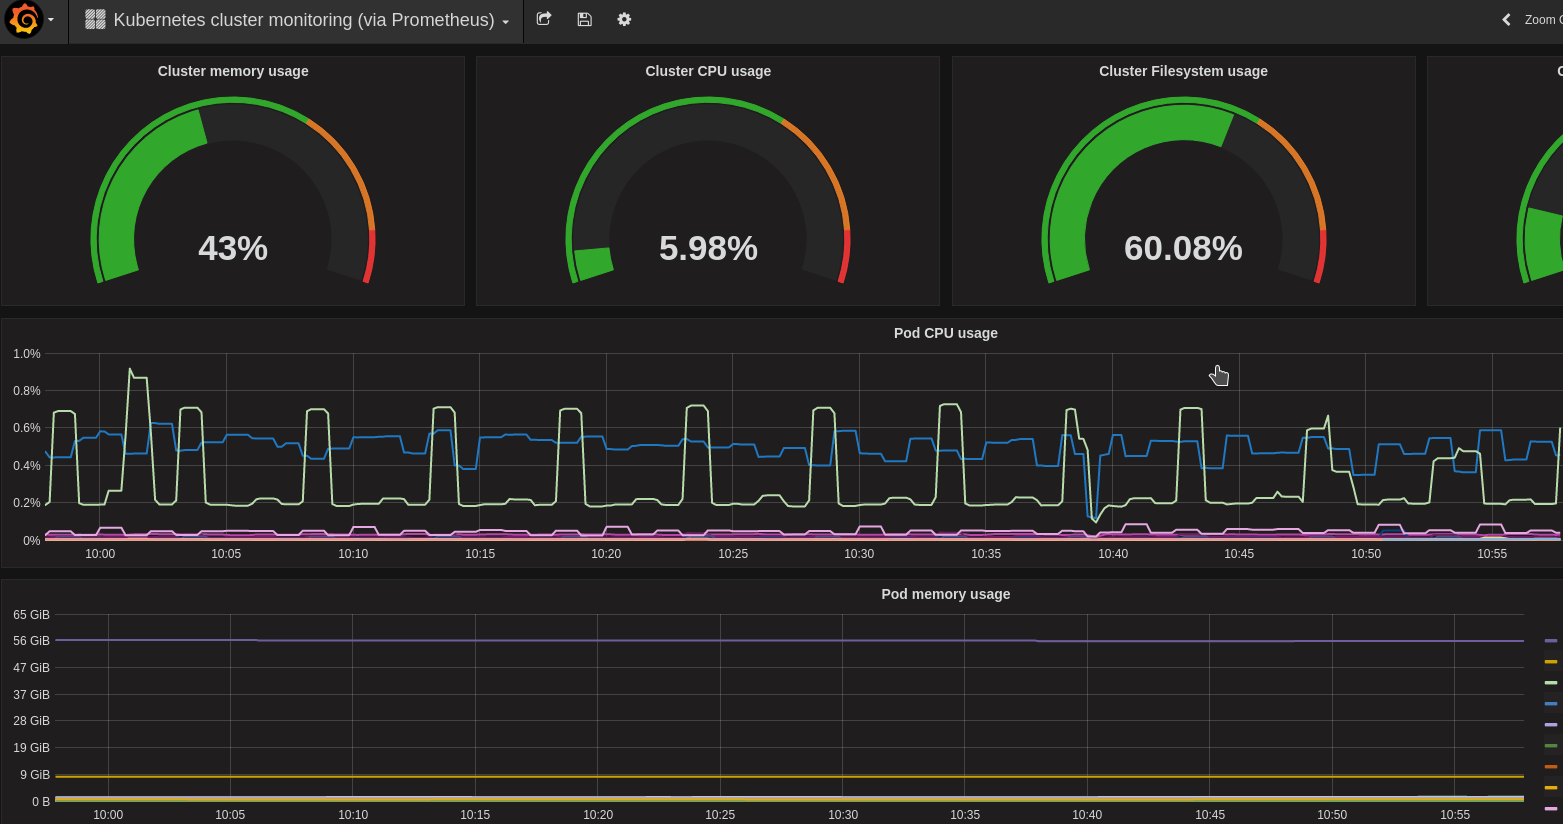
Grafana dashboards
Initial Grafana dashboards were taken from this repo and adjusted.
Ingress controller
Example of an ingress controller to get an access from outside:
apiVersion: extensions/v1beta1
kind: Ingress
metadata:
  annotations:
    ingress.kubernetes.io/auth-realm: Authentication Required
    ingress.kubernetes.io/auth-secret: internal-services-auth
    ingress.kubernetes.io/auth-type: basic
    kubernetes.io/ingress.allow-http: "false"
  name: ingress-monitoring
  namespace: monitoring
spec:
  tls:
  - hosts:
    - prometheus.example.com
    - grafana.example.com
    secretName: example-tls
  rules:
  - host: prometheus.example.com
    http:
      paths:
      - path: /
        backend:
          serviceName: prometheus-svc
          servicePort: 9090
      - path: /alertmanager
        backend:
          serviceName: alertmanager
          servicePort: 9093
  - host: grafana.example.com
    http:
      paths:
      - path: /
        backend:
          serviceName: grafana
          servicePort: 3000
If you still don't have an Ingress controller installed, you can use manifests from the test_ingress directory for test purposes.
Alerting
Included alert rules
Prometheus alert rules which are already included in this repo:
- NodeCPUUsage > 50%
- NodeLowRootDisk > 80% (relates to
/root-diskmount point insidenode-exporterpod) - NodeLowDataDisk > 80% (relates to
/data-diskmount point insidenode-exporterpod) - NodeSwapUsage > 10%
- NodeMemoryUsage > 75%
- ESLogsStatus (alerts when Elasticsearch cluster status goes yellow or red)
- NodeLoadAverage (alerts when node's load average divided by amount of CPUs exceeds 1)
Notifications
alertmanager-configmap.yaml contains smtp_* and slack_* inside the global sections. Adjust them to meet your needs.
Updating configuration
Prometheus configuration
Update command line parameters
Modify prometheus-deployment.yaml and apply a manifest:
kubectl --namespace=monitoring apply -f prometheus-deployment.yaml
If deployment manifest was changed, all Prometheus pods will be restarted with data loss.
Update configfile
Update prometheus-configmap.yaml or prometheus-rules directory contents and apply them:
./update_prometheus_config.sh
# or
./update_prometheus_rules.sh
These scripts will update configmaps, wait until changes will be delivered into the pod volume (if the configmap was not changed, this script will work forever) and reload the configs. You can also reload configs manually using the commands below:
curl -XPOST --user "%username%:%password%" https://prometheus.example.com/-/reload
# or
kubectl --namespace=monitoring exec $(kubectl --namespace=monitoring get pods -l app=prometheus -o jsonpath={.items..metadata.name}) -- killall -HUP prometheus
Alertmanager configuration
Update command line parameters
Modify alertmanager-deployment.yaml and apply a manifest:
kubectl --namespace=monitoring apply -f alertmanager-deployment.yaml
If deployment manifest was changed, all Alertmanager pods will be restarted with data loss.
Update configfile
Update alertmanager-configmap.yaml or alertmanager-templates directory contents and apply them:
./update_alertmanager_config.sh
# or
./update_alertmanager_templates.sh
These scripts will update configmaps, wait until changes will be delivered into the pod volume (if the configmap was not changed, this script will work forever) and reload the configs. You can also reload configs manually using the commands below:
curl -XPOST --user "%username%:%password%" https://prometheus.example.com/alertmanager/-/reload
# or
kubectl --namespace=monitoring exec $(kubectl --namespace=monitoring get pods -l app=alertmanager -o jsonpath={.items..metadata.name}) -- killall -HUP alertmanager

