All Projects → jetstack → Version Checker

jetstack / Version Checker

Licence: apache-2.0
Kubernetes utility for exposing image versions in use, compared to latest available upstream, as metrics.

Programming Languages

go
31211 projects - #10 most used programming language

Projects that are alternatives of or similar to Version Checker

Slo Generator
Easy setup a service level objective using prometheus
Stars: ✭ 91 (-75.47%)
Mutual labels:  prometheus, grafana, sre
Prometheus
A docker-compose stack for Prometheus monitoring
Stars: ✭ 3,383 (+811.86%)
Mutual labels:  prometheus, grafana, grafana-dashboard
Unifiedmetrics
Fully-featured metrics collection agent for Minecraft servers. Supports Prometheus and InfluxDB. Dashboard included out-of-box.
Stars: ✭ 29 (-92.18%)
Mutual labels:  prometheus, grafana, grafana-dashboard
Pihole Exporter
A Prometheus exporter for PI-Hole's Raspberry PI ad blocker
Stars: ✭ 352 (-5.12%)
Mutual labels:  prometheus, grafana, grafana-dashboard
Cloudprober
An active monitoring software to detect failures before your customers do.
Stars: ✭ 1,269 (+242.05%)
Mutual labels:  prometheus, grafana, sre
Appmetrics
App Metrics is an open-source and cross-platform .NET library used to record and report metrics within an application.
Stars: ✭ 1,986 (+435.31%)
Mutual labels:  prometheus, grafana, grafana-dashboard
horizon-exporter
Export Laravel Horizon metrics using this Prometheus exporter.
Stars: ✭ 17 (-95.42%)
Mutual labels:  grafana, prometheus
iota-nelson-node
IOTA Nelson docker-compose file with prometheus and grafana dashboard
Stars: ✭ 39 (-89.49%)
Mutual labels:  grafana, prometheus
docker-prometheus
A minimal Prometheus Server, Node Exporter, BlackBox Exporter and Grafana implementation with `docker-compose`.
Stars: ✭ 71 (-80.86%)
Mutual labels:  grafana, prometheus
Agent
Prometheus Metrics, Loki Logs, and Tempo Traces, optimized for Grafana Cloud.
Stars: ✭ 265 (-28.57%)
Mutual labels:  prometheus, grafana
K8s Tew
Kubernetes - The Easier Way
Stars: ✭ 269 (-27.49%)
Mutual labels:  prometheus, grafana
Hastic Server
Hastic data management server for analyzing patterns and anomalies from Grafana
Stars: ✭ 292 (-21.29%)
Mutual labels:  prometheus, grafana
centos-script
🎉centos下工具安装脚本,包含基础环境配置,Gitlab、Docker、LDAP、MongoDB、MySQL、RabbitMQ、Supervisor、Node、Python、zsh、rar、zabbix、k8s、prometheus、grafana等🎉
Stars: ✭ 121 (-67.39%)
Mutual labels:  grafana, prometheus
chia-monitor
🍃 A comprehensive monitoring and alerting solution for the status of your Chia farmer and harvesters.
Stars: ✭ 131 (-64.69%)
Mutual labels:  grafana, prometheus
cloud-computer
☁️ The Cloud Native Computer
Stars: ✭ 5 (-98.65%)
Mutual labels:  grafana, prometheus
metrics-server-exporter
Metrics Server Exporter
Stars: ✭ 58 (-84.37%)
Mutual labels:  grafana, prometheus
atop-graphite-grafana-monitoring
Tools to extract raw system counters from atop, aggregate them to generate high level performance metrics, whose are then injected into a Graphite database and visualize through Grafana dashboards.
Stars: ✭ 15 (-95.96%)
Mutual labels:  grafana, grafana-dashboard
Go Project Sample
Introduce the best practice experience of Go project with a complete project example.通过一个完整的项目示例介绍Go语言项目的最佳实践经验.
Stars: ✭ 344 (-7.28%)
Mutual labels:  prometheus, grafana
Grabana
User-friendly Go library for building Grafana dashboards
Stars: ✭ 313 (-15.63%)
Mutual labels:  grafana, grafana-dashboard
Awesome Monitoring
INFRASTRUCTURE、OPERATION SYSTEM and APPLICATION monitoring tools for Operations.
Stars: ✭ 356 (-4.04%)
Mutual labels:  prometheus, grafana

version-checker

version-checker is a Kubernetes utility for observing the current versions of images running in the cluster, as well as the latest available upstream. These checks get exposed as Prometheus metrics to be viewed on a dashboard, or soft alert cluster operators.

This tool is currently experimental.

If you're interested in this tool, version checking is a built-in feature in our Preflight product. You may want to check it out if you would like multi-cluster component version checking.

Registries

version-checker supports the following registries:

These registries support authentication.


Installation

version-checker can be installed as either static manifests;

$ kubectl apply -k ./deploy/yaml

Or through helm;

$ cd ./deploy/charts/version-checker && kubectl create namespace version-checker
$ helm install version-checker . -n version-checker

The helm chart supports creating a Prometheus/ServiceMonitor to expose the version-checker metrics.

Grafana Dashboard

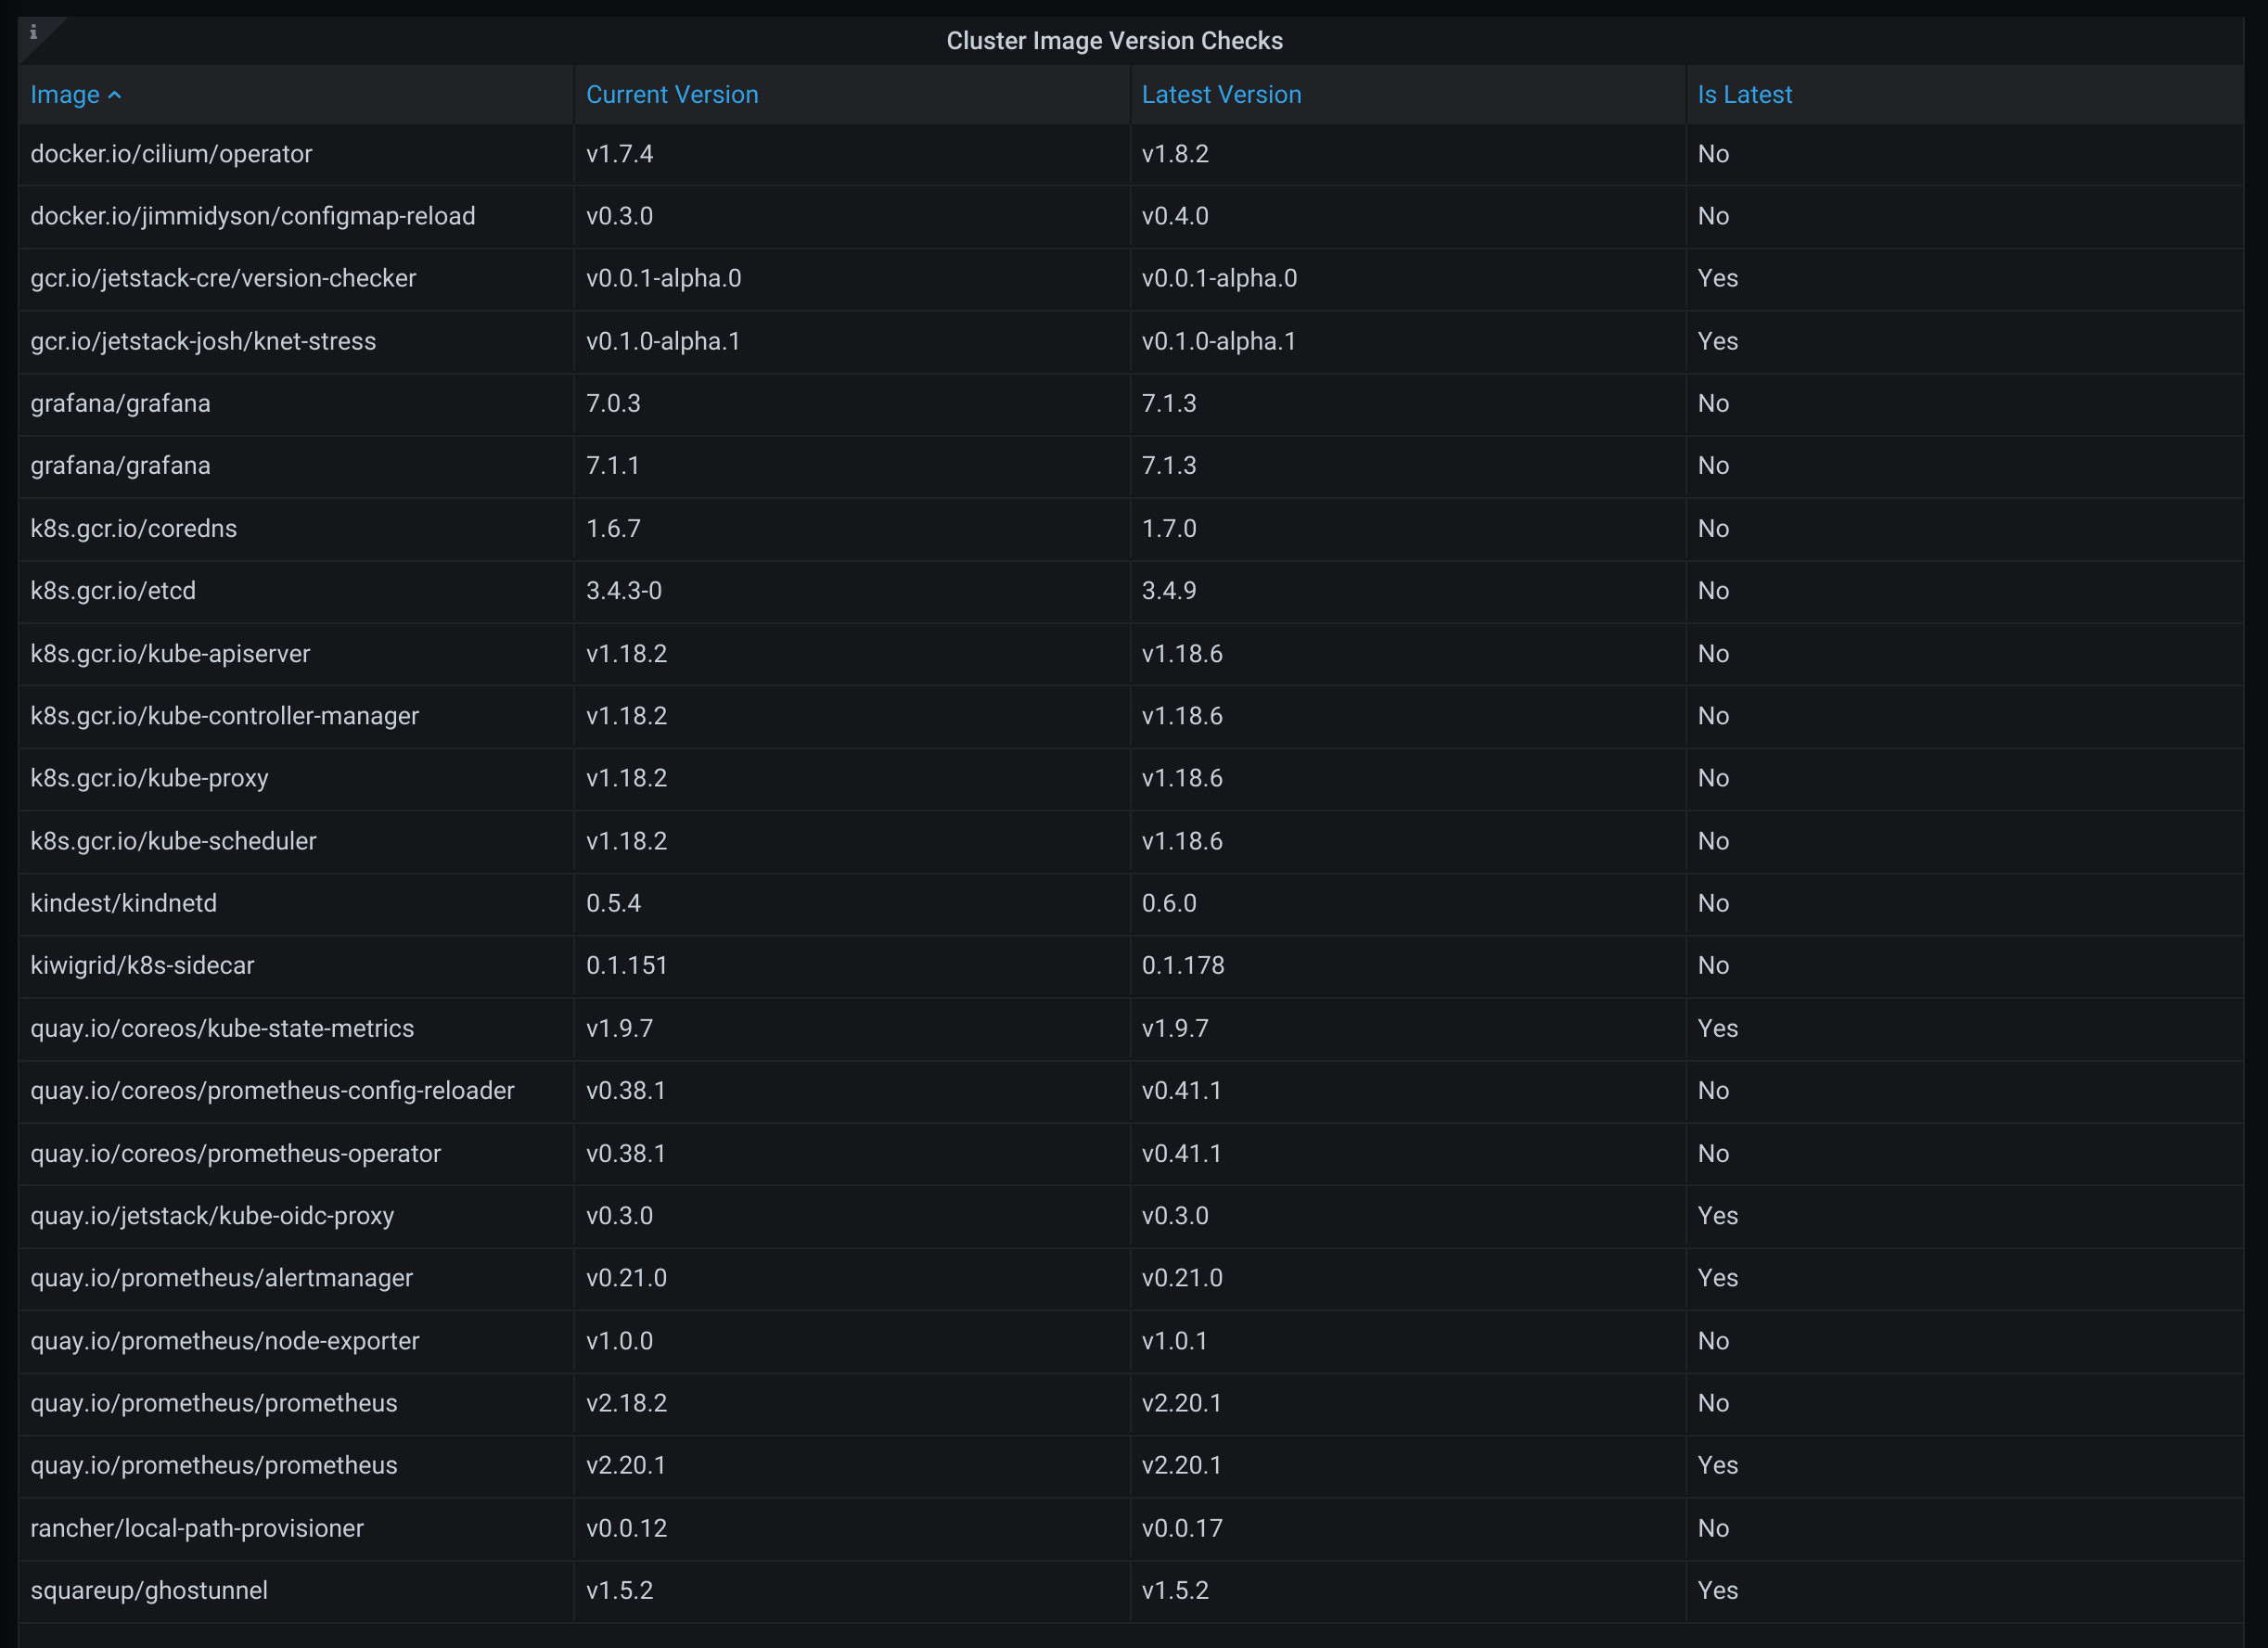
A grafana dashboard is also available to view the image versions as a table.

Grafana Dashboard


Options

By default, without the flag -a, --test-all-containers, version-checker will only test containers where the pod has the annotation enable.version-checker.io/*my-container*, where *my-container* is the name of the container in the pod.

version-checker supports the following annotations present on other pods to enrich version checking on image tags:

  • pin-major.version-checker.io/my-container: 4: will pin the major version to check to 4 (v4.0.0).

  • pin-minor.version-checker.io/my-container: 3: will pin the minor version to check to 3 (v0.3.0).

  • pin-patch.version-checker.io/my-container: 23: will pin the patch version to check to 23 (v0.0.23).

  • use-metadata.version-checker.io/my-container: "true": will allow to search for image tags which contain information after the first part of the semver string. For example, this can be pre-releases or build metadata (v1.2.4-alpha.0, v1.2.3-debian-r3).

  • use-sha.version-checker.io/my-container: "true": will check against the latest SHA tag available. Essentially, the latest image by date. This is silently set to true if no image tag, or "latest" image tag is set. Cannot be used with any other options.

  • match-regex.version-checker.io/my-container: ^v\d+\.\d+\.\d+-debian-: is used for only comparing against image tags which match the regex set. For example, the above annotation will only check against image tags which have the form of something like v1.3.4-debian-r30. use-metadata.version-checker.io is not required when this is set. All other options, apart from URL overrides, are ignored when this is set.

  • override-url.version-checker.io/my-container: docker.io/bitnami/etcd: is used to change the URL for where to lookup where the latest image version is. In this example, the current version of my-container will be compared against the image versions in the docker.io/bitnami/etcd registry.

Metrics

By default, version-checker will expose the version information as Prometheus metrics on 0.0.0.0:8080/metrics.

Note that the project description data, including the texts, logos, images, and/or trademarks, for each open source project belongs to its rightful owner. If you wish to add or remove any projects, please contact us at [email protected].