All Projects → grafana → Kubernetes App

grafana / Kubernetes App

Licence: apache-2.0
A set of dashboards and panels for kubernetes.

Programming Languages

typescript
32286 projects

Projects that are alternatives of or similar to Kubernetes App

Awesome Monitoring
INFRASTRUCTURE、OPERATION SYSTEM and APPLICATION monitoring tools for Operations.
Stars: ✭ 356 (-10.55%)
Mutual labels:  prometheus, grafana
Version Checker
Kubernetes utility for exposing image versions in use, compared to latest available upstream, as metrics.
Stars: ✭ 371 (-6.78%)
Mutual labels:  prometheus, grafana
docker-prometheus
A minimal Prometheus Server, Node Exporter, BlackBox Exporter and Grafana implementation with `docker-compose`.
Stars: ✭ 71 (-82.16%)
Mutual labels:  grafana, prometheus
horizon-exporter
Export Laravel Horizon metrics using this Prometheus exporter.
Stars: ✭ 17 (-95.73%)
Mutual labels:  grafana, prometheus
Zenko
Zenko is the open source multi-cloud data controller: own and keep control of your data on any cloud.
Stars: ✭ 353 (-11.31%)
Mutual labels:  prometheus, grafana
iota-nelson-node
IOTA Nelson docker-compose file with prometheus and grafana dashboard
Stars: ✭ 39 (-90.2%)
Mutual labels:  grafana, prometheus
K8s Tew
Kubernetes - The Easier Way
Stars: ✭ 269 (-32.41%)
Mutual labels:  prometheus, grafana
flask prometheus metrics
Prometheus Metrics for Flask Web App
Stars: ✭ 17 (-95.73%)
Mutual labels:  grafana, prometheus
Edgerealtimevideoanalytics
An example of using Redis Streams, RedisGears, RedisAI and RedisTimeSeries for Realtime Video Analytics (i.e. counting people)
Stars: ✭ 305 (-23.37%)
Mutual labels:  prometheus, grafana
Prometheus
A docker-compose stack for Prometheus monitoring
Stars: ✭ 3,383 (+750%)
Mutual labels:  prometheus, grafana
centos-script
🎉centos下工具安装脚本,包含基础环境配置,Gitlab、Docker、LDAP、MongoDB、MySQL、RabbitMQ、Supervisor、Node、Python、zsh、rar、zabbix、k8s、prometheus、grafana等🎉
Stars: ✭ 121 (-69.6%)
Mutual labels:  grafana, prometheus
Kubegraf
Grafana-plugin for k8s' monitoring
Stars: ✭ 345 (-13.32%)
Mutual labels:  prometheus, grafana
chia-monitor
🍃 A comprehensive monitoring and alerting solution for the status of your Chia farmer and harvesters.
Stars: ✭ 131 (-67.09%)
Mutual labels:  grafana, prometheus
cloud-computer
☁️ The Cloud Native Computer
Stars: ✭ 5 (-98.74%)
Mutual labels:  grafana, prometheus
metrics-server-exporter
Metrics Server Exporter
Stars: ✭ 58 (-85.43%)
Mutual labels:  grafana, prometheus
Agent
Prometheus Metrics, Loki Logs, and Tempo Traces, optimized for Grafana Cloud.
Stars: ✭ 265 (-33.42%)
Mutual labels:  prometheus, grafana
laracom
laracom driven by go micro services
Stars: ✭ 37 (-90.7%)
Mutual labels:  grafana, prometheus
loki exporter
Prometheus exporter to collect metrics and run queries against the Grafana Loki API.
Stars: ✭ 28 (-92.96%)
Mutual labels:  grafana, prometheus
Hastic Server
Hastic data management server for analyzing patterns and anomalies from Grafana
Stars: ✭ 292 (-26.63%)
Mutual labels:  prometheus, grafana
Pihole Exporter
A Prometheus exporter for PI-Hole's Raspberry PI ad blocker
Stars: ✭ 352 (-11.56%)
Mutual labels:  prometheus, grafana

Grafana App for Kubernetes

Kubernetes is an open-source system for automating deployment, scaling, and management of containerized applications.

The Grafana Kubernetes App allows you to monitor your Kubernetes cluster's performance. It includes 4 dashboards, Cluster, Node, Pod/Container and Deployment. It allows for the automatic deployment of the required Prometheus exporters and a default scrape config to use with your in cluster Prometheus deployment. The metrics collected are high-level cluster and node stats as well as lower level pod and container stats. Use the high-level metrics to alert on and the low-level metrics to troubleshoot.

Container Dashboard

Container Dashboard

Node Dashboard

Requirements

  1. Currently only has support for Prometheus
  2. For automatic deployment of the exporters, then Kubernetes 1.6 or higher is required.
  3. Grafana 5.0.0+

Features

  • The app uses Kubernetes tags to allow you to filter pod metrics. Kubernetes clusters tend to have a lot of pods and a lot of pod metrics. The Pod/Container dashboard leverages the pod tags so you can easily find the relevant pod or pods.

  • Easy installation of exporters, either a one click deploy from Grafana or detailed instructions to deploy them manually them with kubectl (also quite easy!)

  • Cluster level metrics that are not available in Heapster, like CPU Capacity vs CPU Usage.
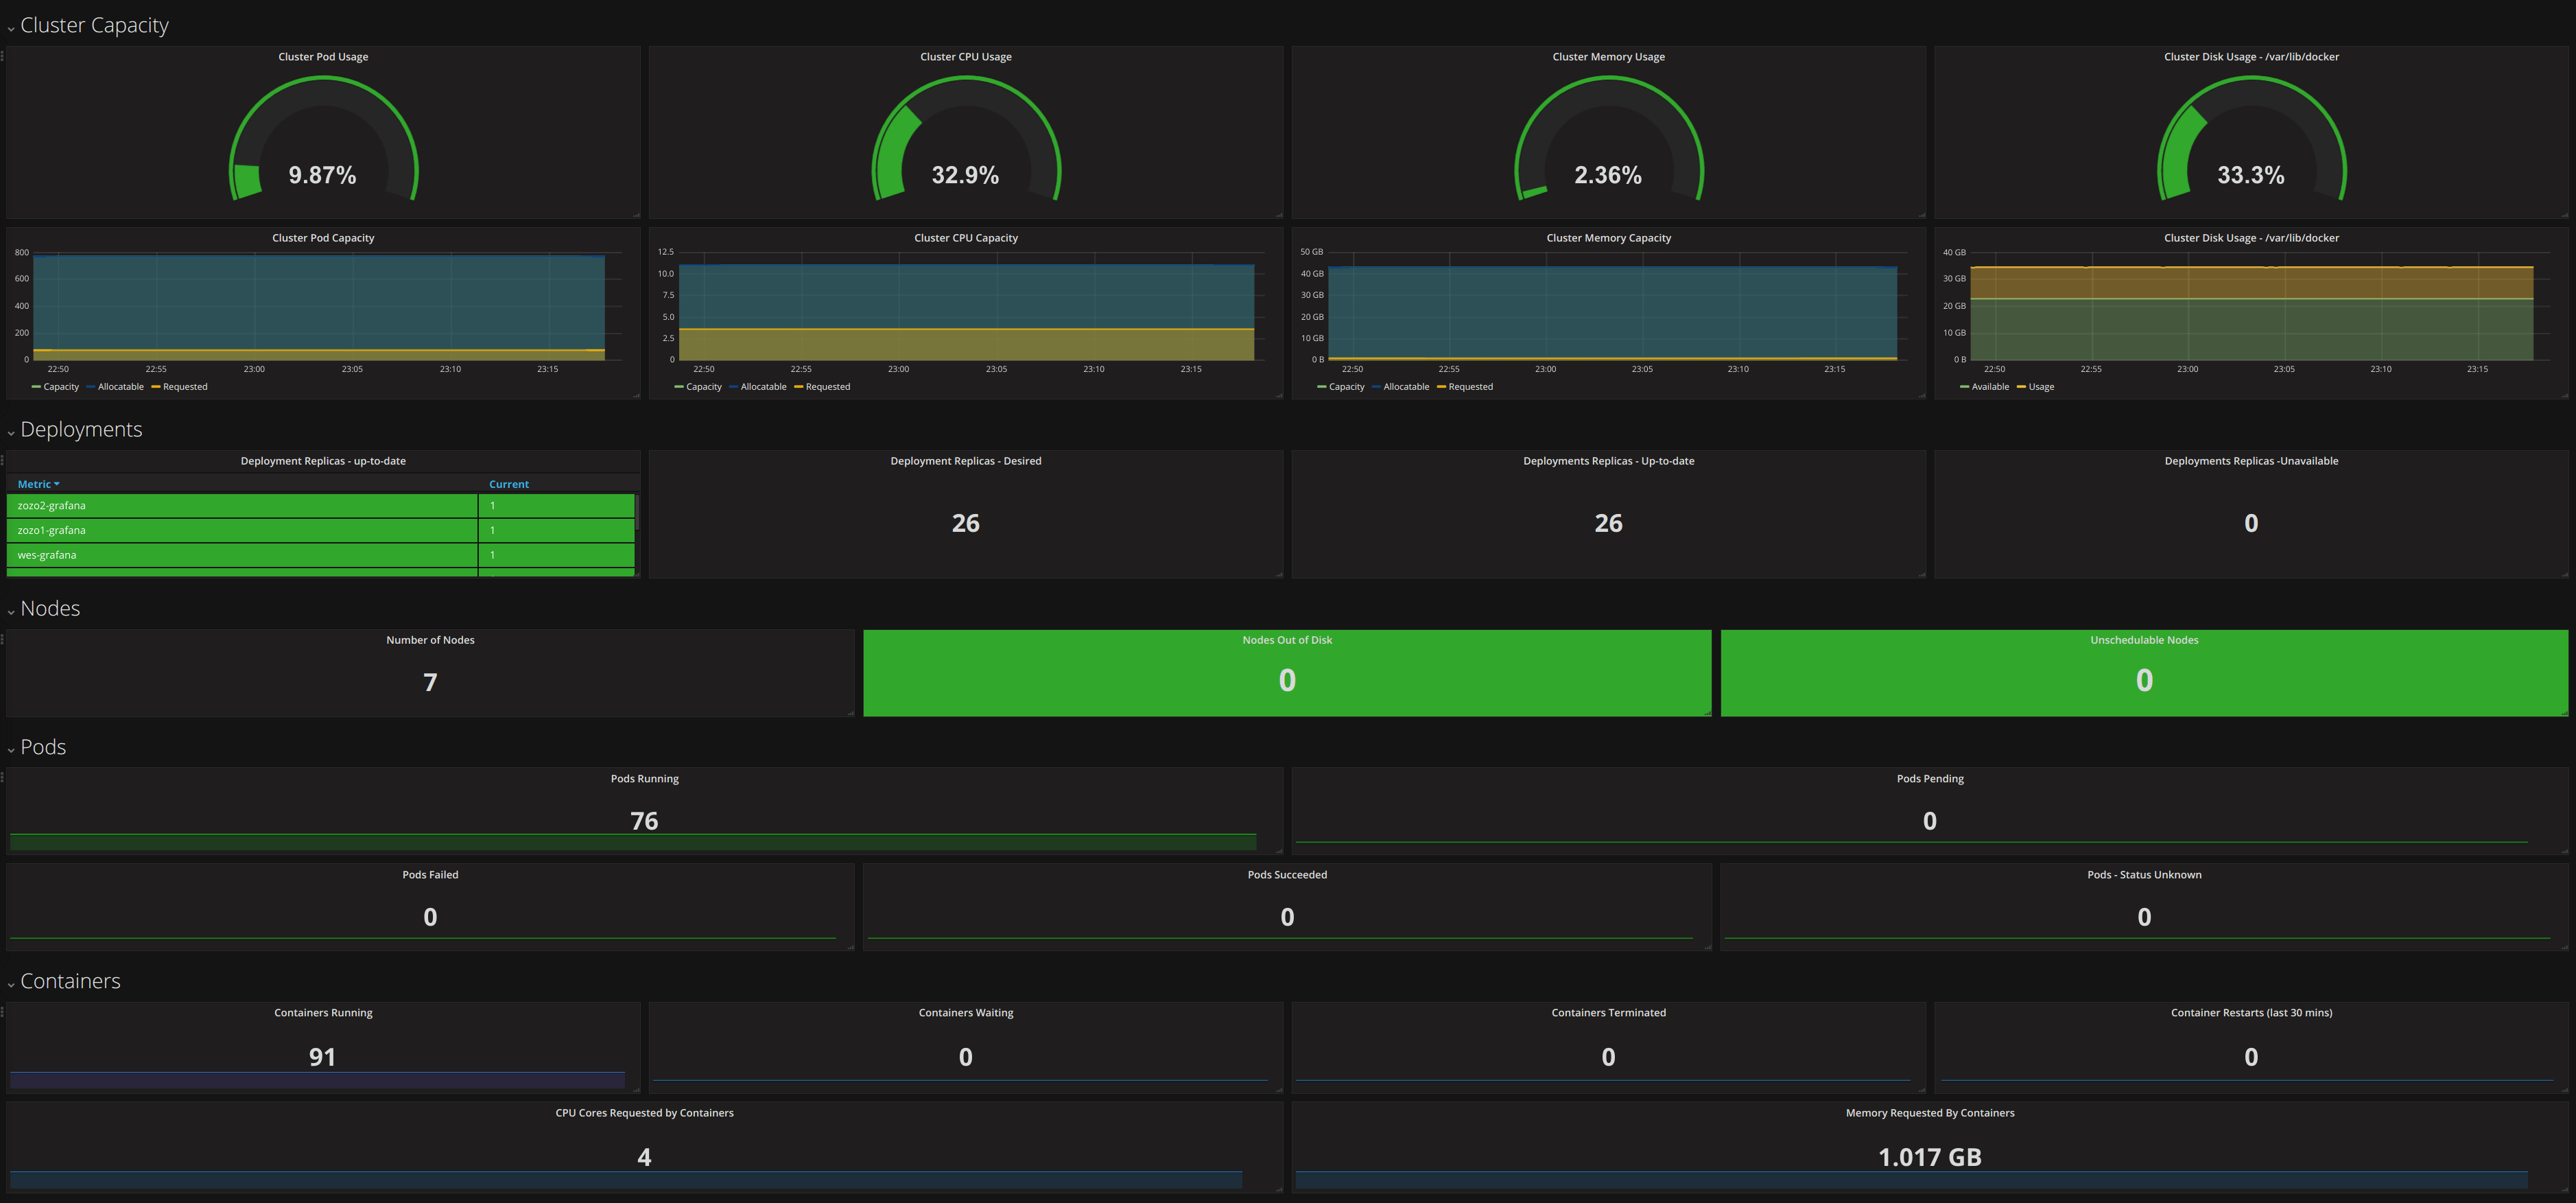
Cluster Metrics

  • Pod Capacity/Usage
  • Memory Capacity/Usage
  • CPU Capacity/Usage
  • Disk Capacity/Usage
  • Overview of Nodes, Pods and Containers
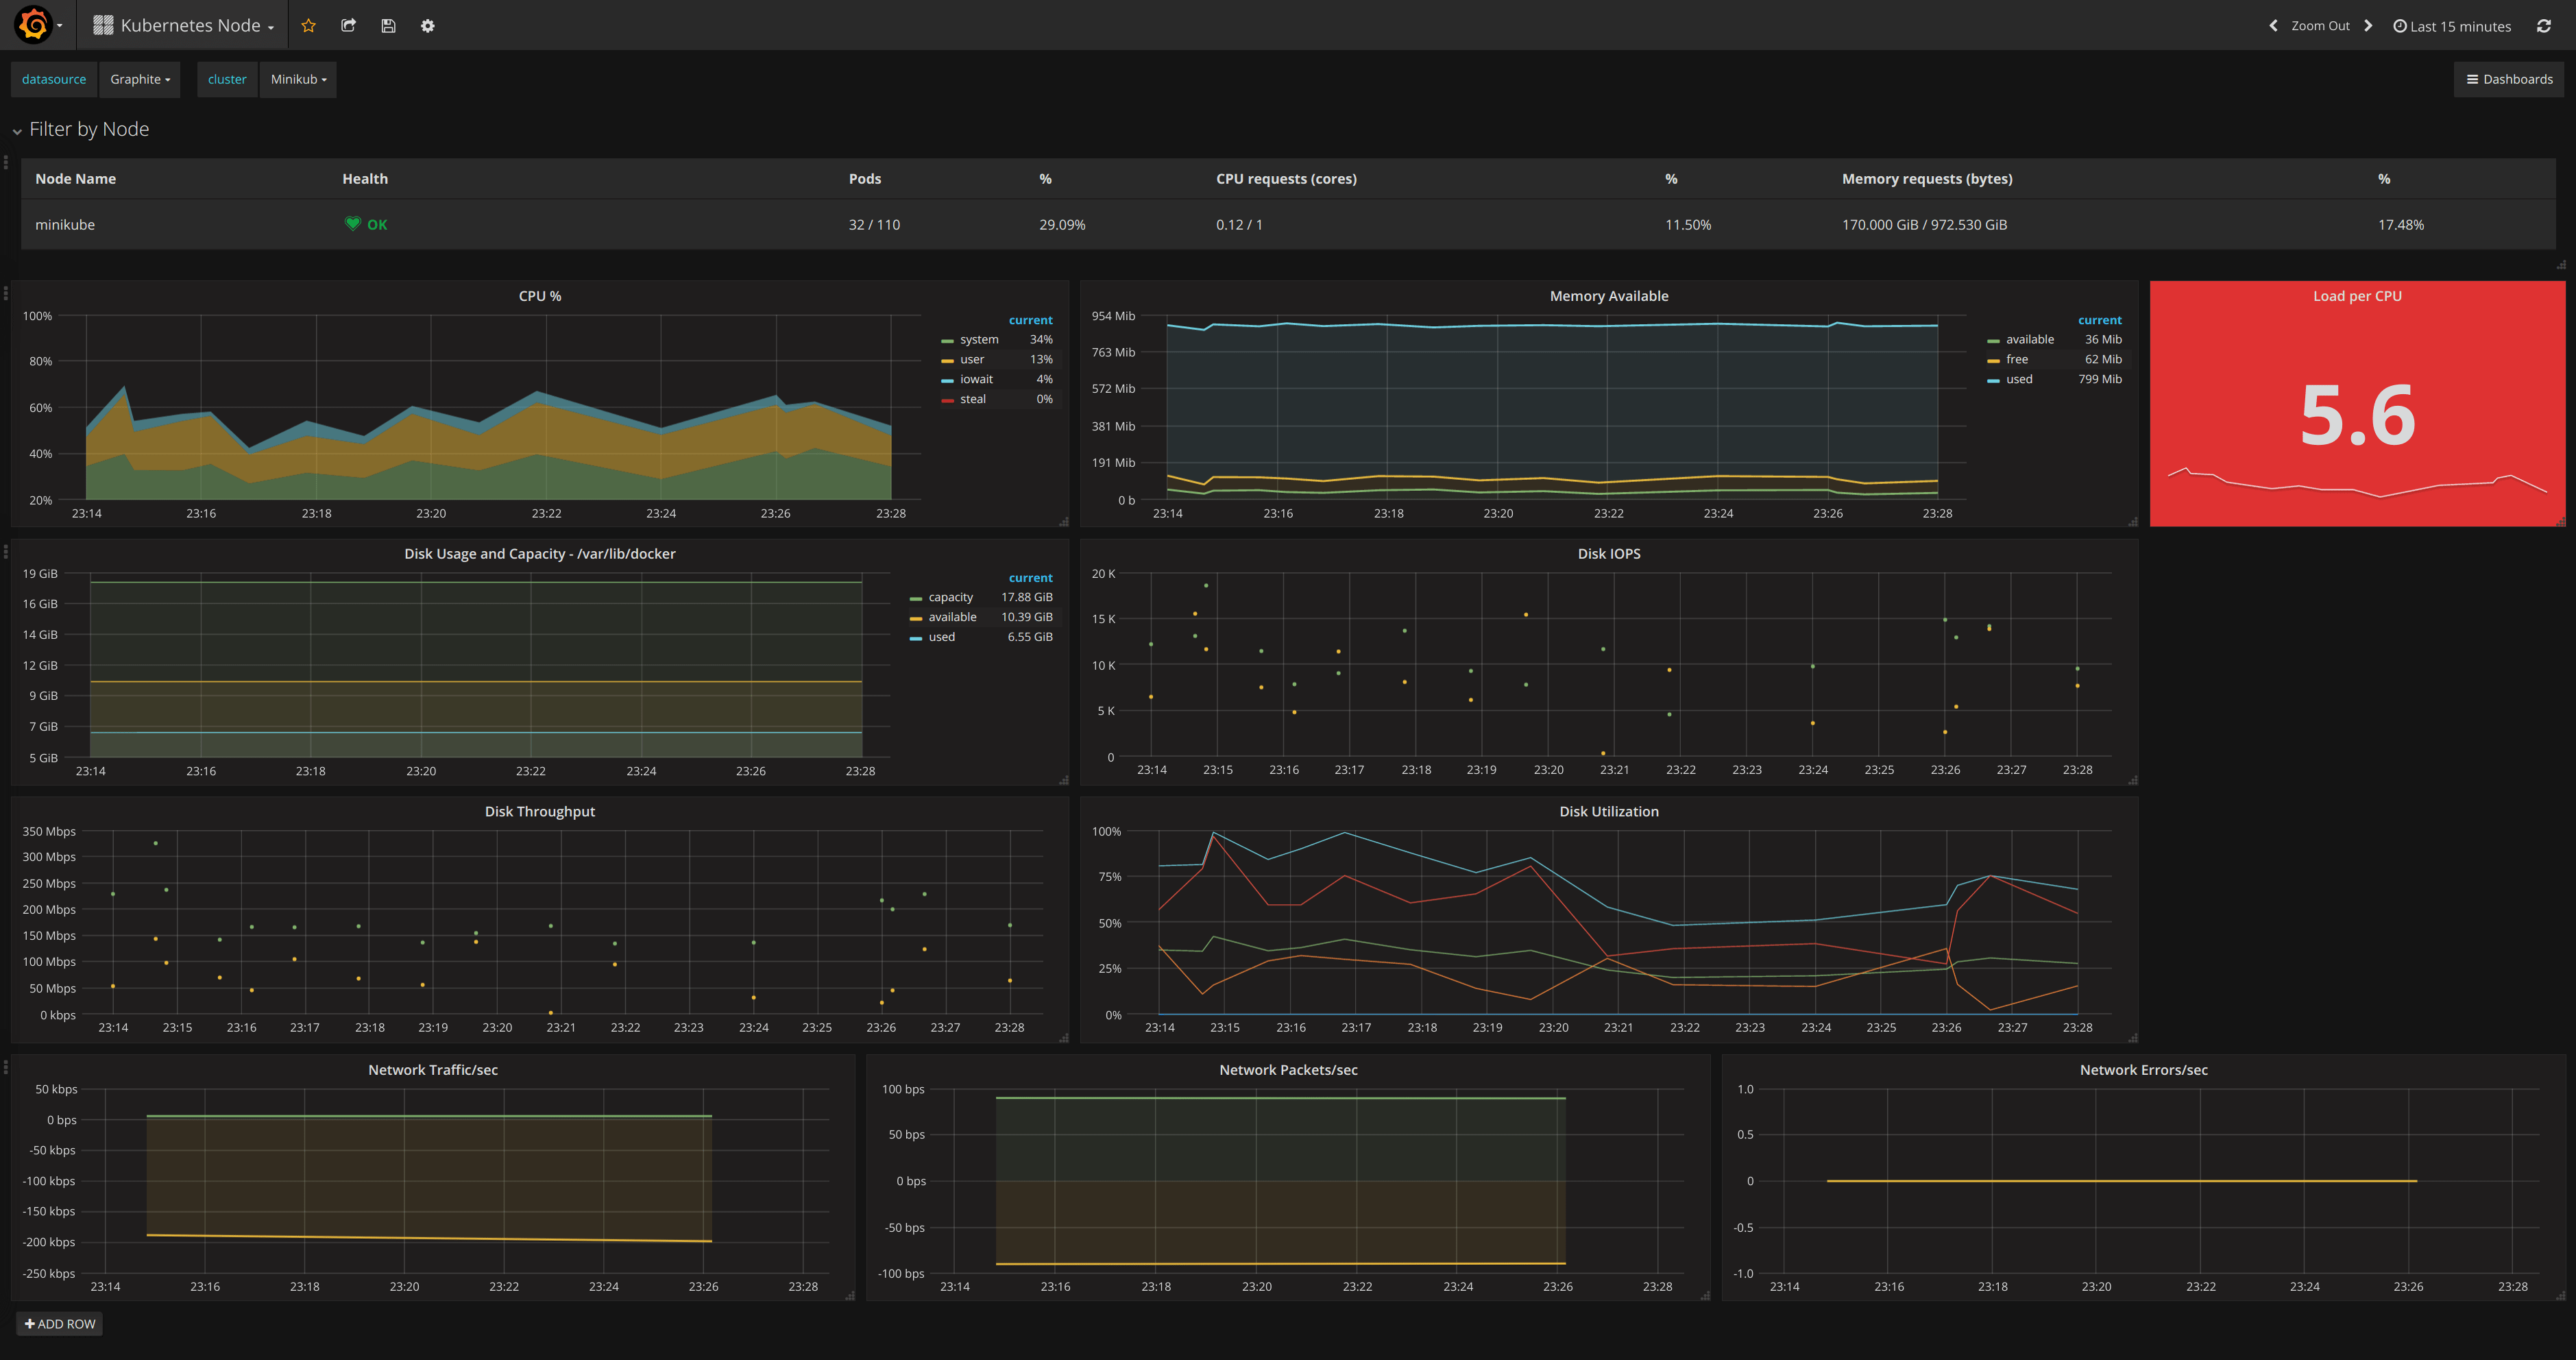
Node Metrics

  • CPU
  • Memory Available
  • Load per CPU
  • Read IOPS
  • Write IOPS
  • %Util
  • Network Traffic/second
  • Network Packets/second
  • Network Errors/second

Pod/Container Metrics

  • Memory Usage
  • Network Traffic
  • CPU Usage
  • Read IOPS
  • Write IOPS

Connect your cluster

  1. Install the plugin per the Installation instructions.

  2. Go to the Cluster List page via the Kubernetes app menu.

    Cluster List in main menu

  3. Click the New Cluster button.

  4. Fill in the Auth details for your cluster.

    TLS certs/keys must be provided in plaintext, not base64 encoded form. For example:

    -----BEGIN CERTIFICATE-----
    MIQWQtAEFeqqfAFeAEGEQWIGNwEQNFGQ4AEFN35AKWadgAENGqiEGNIWm1QETDGF
    ...
    -----END CERTIFICATE-----
    
  5. Choose the Prometheus datasource that will be used for reading data in the dashboards.

  6. Click Deploy. This will deploy a Node Exporter DaemonSet, to collect health metrics for every node, and a Deployment that collects cluster metrics.

Feedback and Questions

Please submit any issues with the app on Github.

Note that the project description data, including the texts, logos, images, and/or trademarks, for each open source project belongs to its rightful owner. If you wish to add or remove any projects, please contact us at [email protected].