All Projects → djaxho → Pure Vue Chart

djaxho / Pure Vue Chart

Simple and lightweight vue chart component without using chart library dependencies

Projects that are alternatives of or similar to Pure Vue Chart

Amcharts4
The most advanced amCharts charting library for JavaScript and TypeScript apps.
Stars: ✭ 907 (+1714%)
Mutual labels:  graph, svg, chart, charts
Graphic
A Flutter data visualization library based on Grammar of Graphics.
Stars: ✭ 173 (+246%)
Mutual labels:  graph, chart, charts
Chart.xkcd
Chart.xkcd is a chart library that plots “sketchy”, “cartoony” or “hand-drawn” styled charts.
Stars: ✭ 6,982 (+13864%)
Mutual labels:  graph, svg, chart
Rickshaw
JavaScript toolkit for creating interactive real-time graphs
Stars: ✭ 6,506 (+12912%)
Mutual labels:  graph, svg, charts
X6
🚀 JavaScript diagramming library that uses SVG and HTML for rendering.
Stars: ✭ 2,686 (+5272%)
Mutual labels:  graph, svg, chart
React D3 Components
D3 Components for React
Stars: ✭ 1,599 (+3098%)
Mutual labels:  graph, chart, charts
Swiftcharts
Easy to use and highly customizable charts library for iOS
Stars: ✭ 2,336 (+4572%)
Mutual labels:  graph, chart, charts
V Chart Plugin
Easily bind a chart to the data stored in your Vue.js components.
Stars: ✭ 188 (+276%)
Mutual labels:  graph, chart, vue-components
Charts
Simple, responsive, modern SVG Charts with zero dependencies
Stars: ✭ 14,112 (+28124%)
Mutual labels:  graph, svg, chart
Fl chart
A powerful Flutter chart library, currently supporting Line Chart, Bar Chart, Pie Chart, Scatter Chart and Radar Chart.
Stars: ✭ 3,882 (+7664%)
Mutual labels:  graph, chart, charts
Billboard.js
📊 Re-usable, easy interface JavaScript chart library based on D3.js
Stars: ✭ 5,032 (+9964%)
Mutual labels:  graph, svg, chart
Uplot
📈 A small, fast chart for time series, lines, areas, ohlc & bars
Stars: ✭ 6,808 (+13516%)
Mutual labels:  graph, chart, charts
C3
📊 A D3-based reusable chart library
Stars: ✭ 9,163 (+18226%)
Mutual labels:  graph, svg, chart
G2
📊 A highly interactive data-driven visualization grammar for statistical charts.
Stars: ✭ 11,020 (+21940%)
Mutual labels:  graph, svg, charts
Laue
🖖📈 Modern charts for Vue 2.0
Stars: ✭ 245 (+390%)
Mutual labels:  svg, chart, charts
Squid
A Ruby library to plot charts in PDF files
Stars: ✭ 205 (+310%)
Mutual labels:  graph, chart, charts
React D3 Tree
🌳 React component to create interactive D3 tree graphs
Stars: ✭ 543 (+986%)
Mutual labels:  graph, svg, chart
Resonance
◾️Resonance | 5kb React animation library
Stars: ✭ 1,011 (+1922%)
Mutual labels:  graph, svg, charts
The Graph
SVG custom elements for FBP graph editing and visualization. Used in noflo/noflo-ui
Stars: ✭ 896 (+1692%)
Mutual labels:  graph, svg
Multi charts
A flutter package which makes it easier to plot different types of charts with lots of customization, made purely in dart
Stars: ✭ 23 (-54%)
Mutual labels:  graph, chart

Pure Vue Chart

A simple and lightweight vue component for making charts that do not rely on large chart libraries and will not bloat your dependencies


Example

<pure-vue-chart
  :points="[3,5,2,5,4]"
  :width="400"
  :height="200"
/>
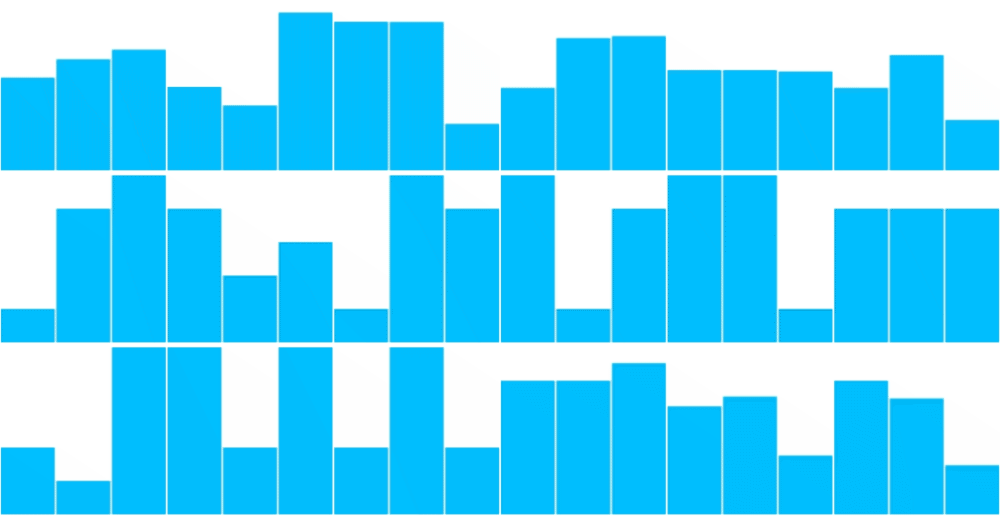
charts

When props are updated the graph will automatically animate to the new values.

Install

npm i pure-vue-chart

Import it:

import PureVueChart from 'pure-vue-chart';

Register it in your component:

components: {
    PureVueChart,
},

Use it

<pure-vue-chart
  :points="[3,5,2,5,4]"
  :width="400"
  :height="200"
/>

Options

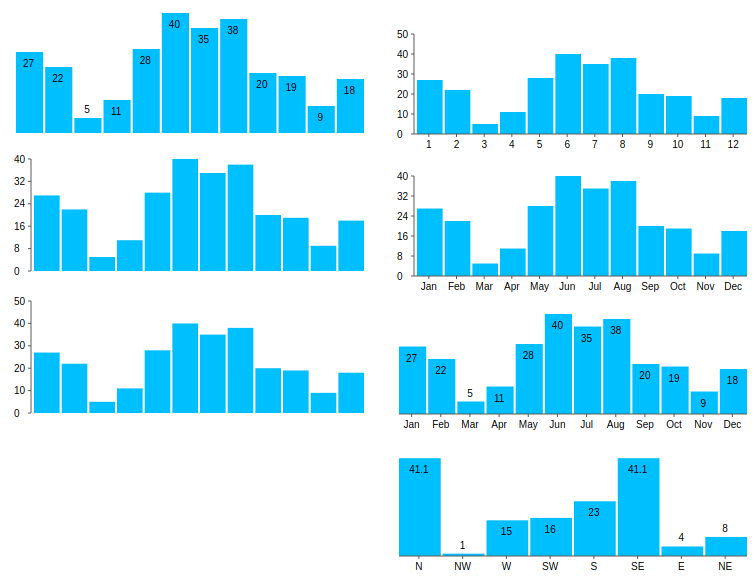
To further control the display of data, you can use simple props to manipulate the charts. Here are some examples:

Most of the available props below are self-explanatory:

:points=[1,4,5,3,4]
:show-y-axis="false"
:show-x-axis="true"
:width="400"
:height="200"
:show-values="true"
:use-month-labels="true"
:months="['Jan', 'Fev', 'Mar', 'Abr', 'Mai', 'Jun', 'Jul', 'Ago', 'Set', 'Out', 'Nov', 'Dez']"

Additional Features:

Trendline

You can add a simple linear trend line by using the following props:

:show-trend-line="true"
:trend-line-width="2"
trend-line-color="lightblue"

X-axis labels:

X-axis labels, by default will be from 1 - length-of-data. But you can automatically use Months by using the prop :use-month-labels="true". Or you can provide the data as an array of objects, each with a value and label like so:

:points=[{label: 'N', value: 41.1}, {label: 'NW', value: 1}, {label: 'W', value: 15}]

Contributing

I'm open to any issues or pull requests so long as they are simple, easy to read, use the eslint settings in package.json, and follow commitizen-esque style commit formats. Just open an issue on github and start a discussion. - pure-vue-chart issues - https://github.com/djaxho/pure-vue-chart/issues

Authors or Acknowledgments

  • Danny Jackson

List of features

  • Simple bar charts
  • Line charts (planned)
  • Pie charts (planned)
  • Rose charts (planned)

License

This project is licensed under the MIT License but please create pull requests to improve this package together rather that copying itto another project.

Note that the project description data, including the texts, logos, images, and/or trademarks, for each open source project belongs to its rightful owner. If you wish to add or remove any projects, please contact us at [email protected].