All Projects → schiegl → Quickplot

schiegl / Quickplot

Licence: gpl-3.0
Quick and easy data visualizations with Haskell

Programming Languages

javascript
184084 projects - #8 most used programming language
haskell
3896 projects

Projects that are alternatives of or similar to Quickplot

Tabix
Tabix.io UI
Stars: ✭ 1,152 (+1304.88%)
Mutual labels:  data-visualization
Awesome Expression Browser
😎 A curated list of software and resources for exploring and visualizing (browsing) expression data 😎
Stars: ✭ 72 (-12.2%)
Mutual labels:  data-visualization
Ac D3
Javascript Library for building Audiovisual Charts in D3
Stars: ✭ 76 (-7.32%)
Mutual labels:  data-visualization
Exploretrees Sg
🌳 Explore Trees in Singapore 🇸🇬
Stars: ✭ 68 (-17.07%)
Mutual labels:  data-visualization
Fizzygum
a new web framework, an entire platform really, designed from the ground up to handle complex things easily. Put the power of an entire Operating System at your fingertips.
Stars: ✭ 70 (-14.63%)
Mutual labels:  data-visualization
React Fusioncharts Component
ReactJS component for FusionCharts JavaScript Charting library.
Stars: ✭ 73 (-10.98%)
Mutual labels:  data-visualization
Graphia
A visualisation tool for the creation and analysis of graphs
Stars: ✭ 67 (-18.29%)
Mutual labels:  data-visualization
Dex
Dex : The Data Explorer -- A data visualization tool written in Java/Groovy/JavaFX capable of powerful ETL and publishing web visualizations.
Stars: ✭ 1,238 (+1409.76%)
Mutual labels:  data-visualization
My Journey In The Data Science World
📢 Ready to learn or review your knowledge!
Stars: ✭ 1,175 (+1332.93%)
Mutual labels:  data-visualization
Agilework
可视化低代码快速开发平台,面向业务、企业管理系统定制开发平台和应用平台,包括设计器、应用端。提供业务配置和集成开发能力,用户通过可视化拖拉拽配置式操作即可快速构建出能同时在PC和移动端运行的各类管理系统,对于企业客户的信息系统在管理模式、业务流程、表单界面、数据可视化展示、IoT管控等个性化需求,可以通过设计器,快速的进行个性化配置。并支持企业微信,公众号,钉钉等移动集成,实现用户跨区域移动办公。从而构建企业个性化的行业应用、集成应用和复杂的业务报表。
Stars: ✭ 76 (-7.32%)
Mutual labels:  data-visualization
Equalareacartogram
Converts a Shapefile, GeoJSON, or CSV to an equal area cartogram
Stars: ✭ 68 (-17.07%)
Mutual labels:  data-visualization
Startr
A template for data journalism in R
Stars: ✭ 69 (-15.85%)
Mutual labels:  data-visualization
Doi Extractives Data
Information on the extractive industries in the U.S. from federal data.
Stars: ✭ 74 (-9.76%)
Mutual labels:  data-visualization
Muze
Composable data visualisation library for web with a data-first approach now powered by WebAssembly
Stars: ✭ 1,153 (+1306.1%)
Mutual labels:  data-visualization
R Raster Vector Geospatial
Introduction to Geospatial Raster and Vector Data with R
Stars: ✭ 76 (-7.32%)
Mutual labels:  data-visualization
Linkedingiveaway
👨🏽‍🏫You can learn about anything over here. What Giveaways I do and why it's important in today's modern world. Are you interested in Giveaway's?🔋
Stars: ✭ 67 (-18.29%)
Mutual labels:  data-visualization
Superset Ui Plugins
A collection of official Superset UI plugins
Stars: ✭ 73 (-10.98%)
Mutual labels:  data-visualization
Openbci Dashboard
A fullstack javascript app for capturing and visualizing OpenBCI EEG data
Stars: ✭ 82 (+0%)
Mutual labels:  data-visualization
Livechart
Android library to draw beautiful and rich line charts.
Stars: ✭ 78 (-4.88%)
Mutual labels:  data-visualization
Deck.gl
WebGL2 powered visualization framework
Stars: ✭ 9,304 (+11246.34%)
Mutual labels:  data-visualization

QuickPlot

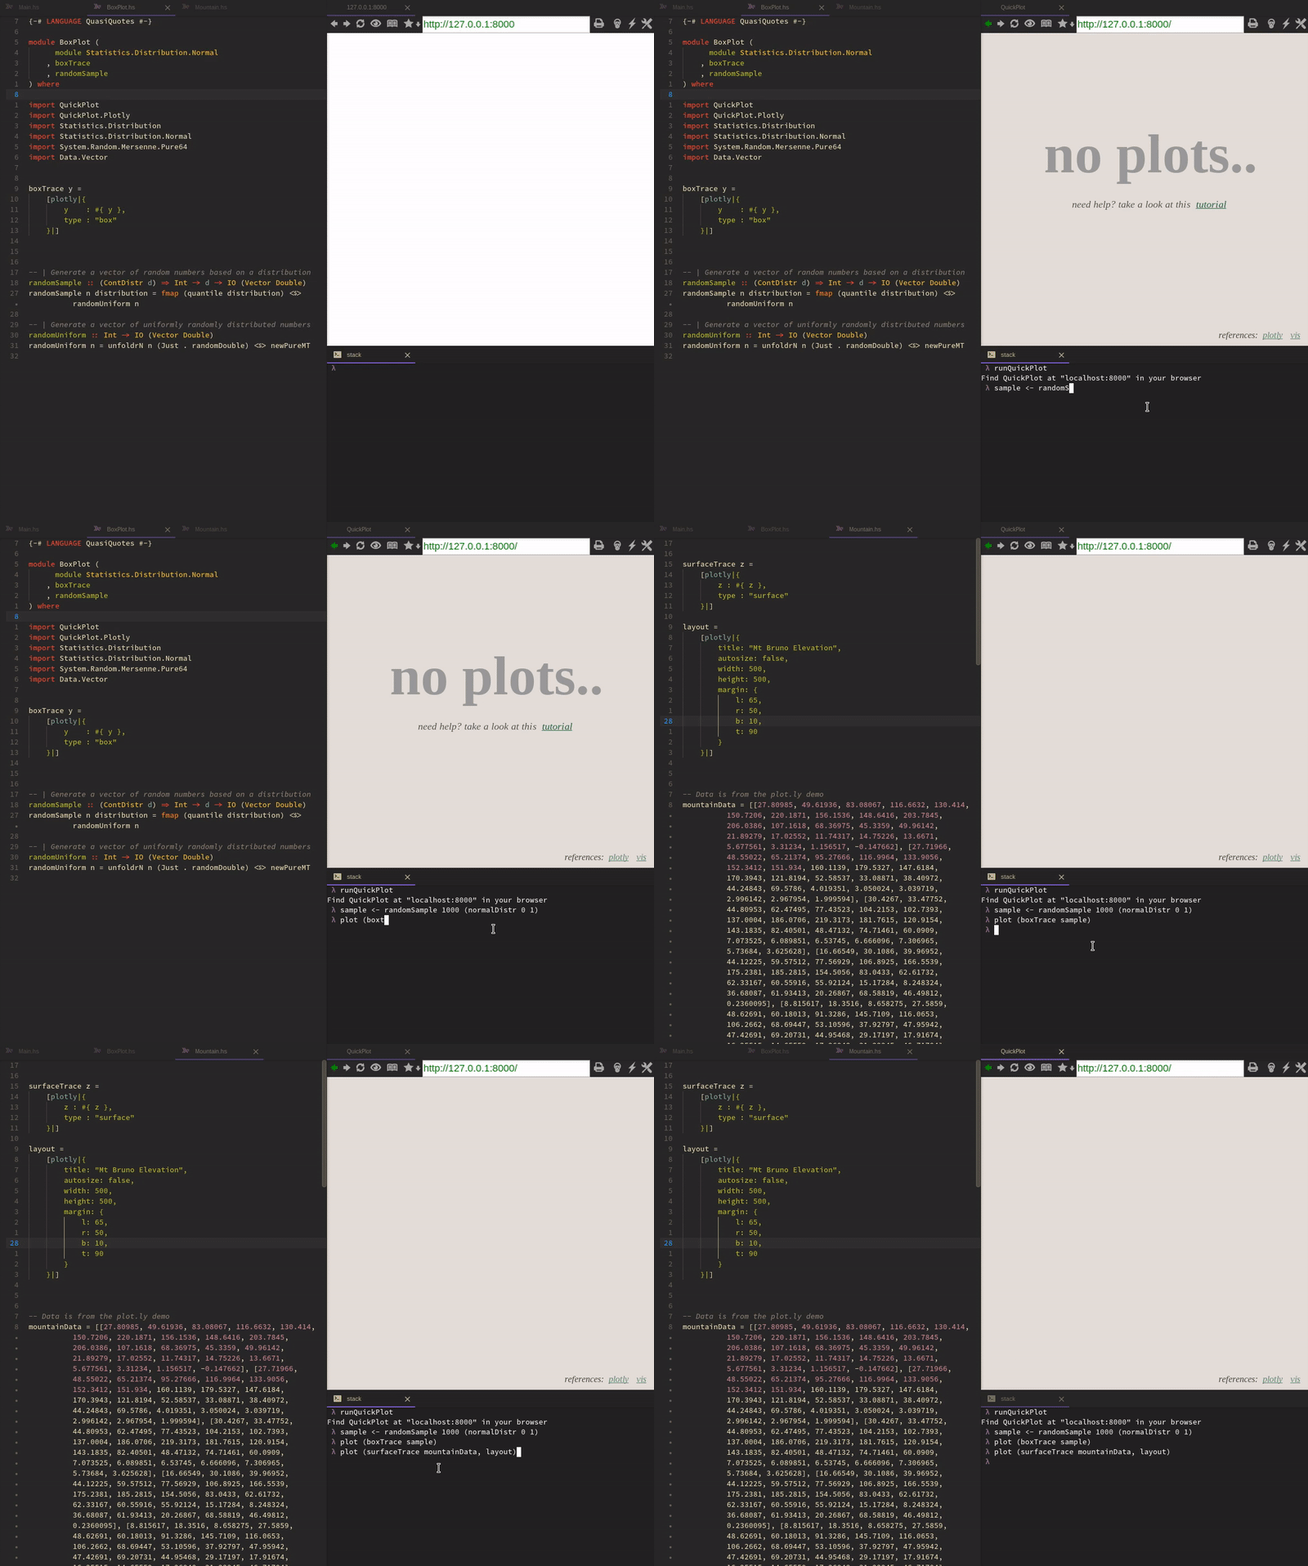
QuickPlot Demo

This project is no longer maintained

Since the demand of data visualization has been getting bigger many language agnostic libraries popped up. It would be much more efficient to just write clients for their visualization servers.

How does it work?

Haskell creates a simple server that runs in the background and sends data to a browser that visualizes it. In the demo above the browser and ghci runs inside Atom, but you can use any editor (even butterflies) with a fairly modern browser. Once the data arrives at the browser any JavaScript visualization library could take care of it like for example plot.ly

How do I use it?

QuickPlot was designed to make interactive data exploration easier. So the following won't make much sense outside of ghci

0. Install QuickPlot

stack install QuickPlot
cabal install QuickPlot
-- or manually

1. Import QuickPlot

import QuickPlot
import QuickPlot.Plotly -- if you want to use the plotly library

2. Start QuickPlot

runQuickPlot

3. Connect to QuickPlot

Go to the address runQuickPlot printed

4. Plot

Here is the less verbose version of the full example:

-- As box aficionados we just measured the weight of all our boxes at home
-- and gathered the following data
blueBoxSizes   = [1.1, 1.8, 2.9, 3.3] :: [Double]
orangeBoxSizes = [3.1, 3.8, 5.9, 2.3] :: [Double]

-- We create traces from our data
blueBoxTrace = [plotly|{
      y    : #{ blueBoxSizes },
      type : "box"
}|]
orangeBoxTrace = [plotly|{
      y    : #{ orangeBoxSizes },
      type : "box"
}|]

-- And finally gain great insight from the data visualization
plot [blueBoxTrace, orangeBoxTrace]

FAQ

Does it work on X?

Probably yes. If your browser supports WebSockets, HTML5, CSS3 you'll be fine. If not please update your browser. Find out more about here

Can you implement library X?

If the library takes JSON as an input, submit an issue. Libraries like D3.js are problematic however. Graphs in D3 are created programatically and therefore you can't just pick a graph type and say plot it. You have to create them from scratch. If there are examples that give you goosebumps it is possible to integrate them separately. Or you just include it as a user script yourself (once this is implemented)

How can I help?

There are many ways to do so:

  • If you know JavaScript/HTML/CSS you could make the UI prettier, more user friendly or easier extensible
  • Implement a visualization library in JavaScript

Can this library only use JavaScript libraries?

Technically any library that Haskell can convice to create graphics is compatible.

Note that the project description data, including the texts, logos, images, and/or trademarks, for each open source project belongs to its rightful owner. If you wish to add or remove any projects, please contact us at [email protected].