aloneszjl / React Native F2chart
Licence: mit
F2 charts for react-native
Stars: ✭ 61
Labels
Projects that are alternatives of or similar to React Native F2chart
Echarts For Vue
📊📈 ECharts wrapper component for Vue 3 and 2
Stars: ✭ 42 (-31.15%)
Mutual labels: chart
React Echarts V3
React.js(v16.x+) component wrap for ECharts.js(v3.x+)
Stars: ✭ 48 (-21.31%)
Mutual labels: chart
D3 In Motion
Code examples and references for the course "D3.js in Motion"
Stars: ✭ 37 (-39.34%)
Mutual labels: chart
Unity Ugui Xcharts
A charting and data visualization library for Unity. 一款基于UGUI的数据可视化图表插件。
Stars: ✭ 1,086 (+1680.33%)
Mutual labels: chart
Django Rest Pandas
📊📈 Serves up Pandas dataframes via the Django REST Framework for use in client-side (i.e. d3.js) visualizations and offline analysis (e.g. Excel)
Stars: ✭ 1,030 (+1588.52%)
Mutual labels: chart
Pure Vue Chart
Simple and lightweight vue chart component without using chart library dependencies
Stars: ✭ 50 (-18.03%)
Mutual labels: chart
Chart
Create the most popular types of charts by real or random data
Stars: ✭ 1,101 (+1704.92%)
Mutual labels: chart
Vaadin Charts
Vaadin Charts is a feature-rich interactive graph library that answers the data visualization needs of modern web applications
Stars: ✭ 47 (-22.95%)
Mutual labels: chart
Asciichart
Nice-looking lightweight console ASCII line charts ╭┈╯ for NodeJS, browsers and terminal, no dependencies
Stars: ✭ 1,107 (+1714.75%)
Mutual labels: chart
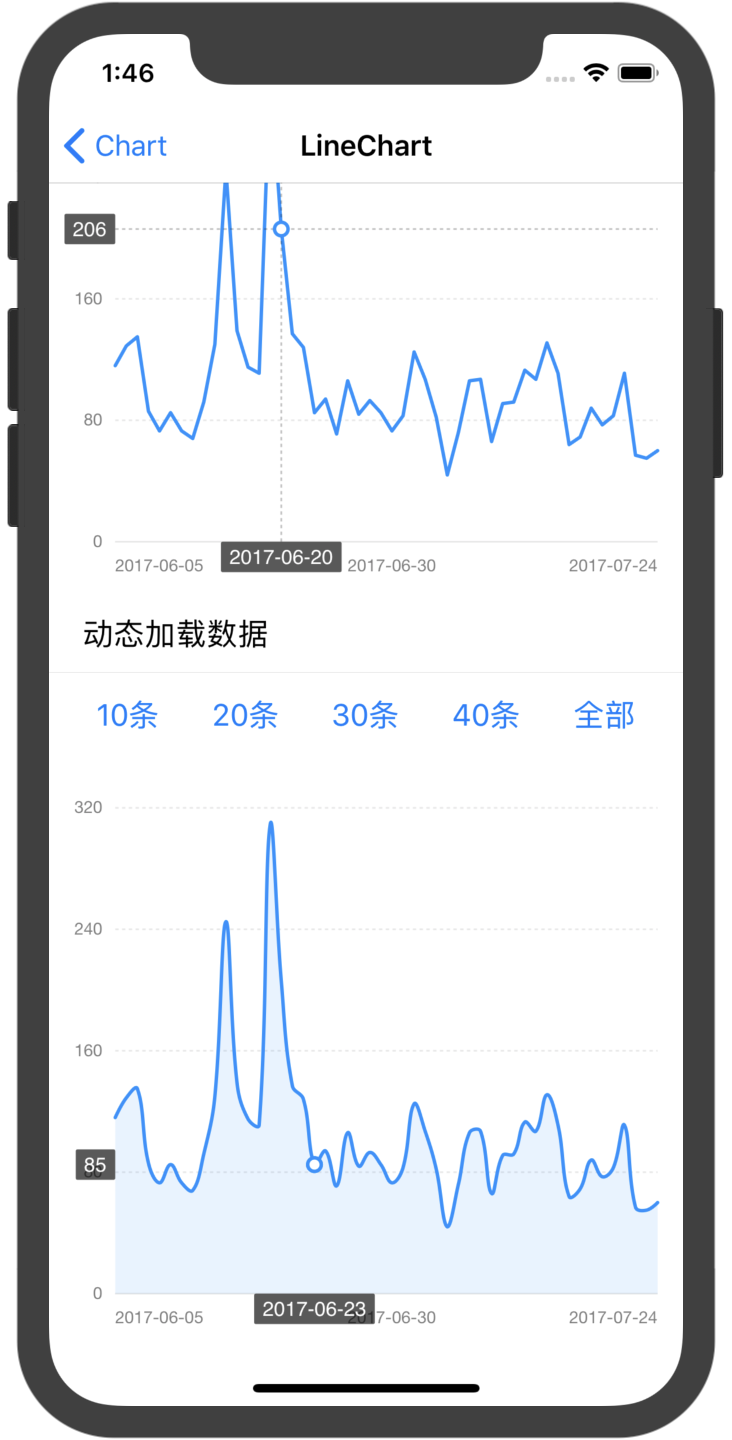
react-native-f2chart
F2 charts for react-native

install
1、
yarn add react-native-f2chart or npm i react-native-f2chart
2、 copy node_moules/react-native-f2chart/src/f2chart.html to android/app/src/main/assets/f2chart.html
simple demo example
usage
import Chart from "react-native-f2chart";

// 参考 https://antv.alipay.com/zh-cn/f2/3.x/demo/line/basic.html
const initScript = data =>`
(function(){
    chart =  new F2.Chart({
        id: 'chart',
        pixelRatio: window.devicePixelRatio,
    });
    chart.source(${JSON.stringify(data)}, {
    value: {
    tickCount: 5,
    min: 0
    },
    date: {
    type: 'timeCat',
    range: [0, 1],
    tickCount: 3
    }
    });
    chart.tooltip({
    custom: true,
    showXTip: true,
    showYTip: true,
    snap: true,
    onChange: function(obj) {
        window.postMessage(stringify(obj))
    },
    crosshairsType: 'xy',
    crosshairsStyle: {
    lineDash: [2]
    }
    });
    chart.axis('date', {
    label: function label(text, index, total) {
    var textCfg = {};
    if (index === 0) {
        textCfg.textAlign = 'left';
    } else if (index === total - 1) {
        textCfg.textAlign = 'right';
    }
    return textCfg;
    }
    });
    chart.line().position('date*value');
    chart.render();
})();
`;

    ...
    render() {
        return (
            <View style={{ height: 350 }}>
              <Chart initScript={initScript(data)} />
            </View>
        )
    }
    ...
`
Props
| Prop | type | Description | Required |
|---|---|---|---|
initScript |
string | 初始化图表的 js 代码,参考 f2 的文档 | yes |
data |
Array | f2 chart source | no |
onChange |
Function | tooltip onchange | no |
webView |
ReactElement | 渲染图表的 webview,可以使用 react-native-webview 代替,默认使用 react-natve 里面的 webview | no |
Notice
- canvas的id 是 'chart',不是文档中的 'mountNode'
- chart 已经在源码的 html 定义过了,在
initScript中,并不需要定义 chart,直接给 chart 赋值即可 - tooltip onchange 中 传输数据时用到的
stringify也是在 html 定义好的,可以直接使用,用JSON.stringify会报错, 原因 - 如果使用的是
react-native-webview,在 tooltip 中的postMessage应该为window.ReactNativeWebView.postMessage
Note that the project description data, including the texts, logos, images, and/or trademarks,
for each open source project belongs to its rightful owner.
If you wish to add or remove any projects, please contact us at [email protected].


