N1ghtly / React Native Responsive Linechart
Licence: mit
A customizable and responsive line or area chart for react-native
Stars: ✭ 105
Programming Languages
typescript
32286 projects
Labels
Projects that are alternatives of or similar to React Native Responsive Linechart
Lazy Line Painter
Lazy Line Painter - A Modern JS library for SVG path animation
Stars: ✭ 1,918 (+1726.67%)
Mutual labels: svg, responsive
Screenshotframes
A small CSS library for adding responsive frames (mobile device, desktop computer, or browser toolbar) to images
Stars: ✭ 18 (-82.86%)
Mutual labels: svg, responsive
Gantt Elastic
Gantt Chart [ javascript gantt chart, gantt component, vue gantt, vue gantt chart, responsive gantt, project manager , vue projects ]
Stars: ✭ 869 (+727.62%)
Mutual labels: svg, responsive
Icons
The premium icon font for @uiwjs Component Library. https://uiwjs.github.io/icons
Stars: ✭ 99 (-5.71%)
Mutual labels: svg
React Responsive Select
A customisable, touchable, React select / multi-select form control. Built with keyboard and screen reader accessibility in mind
Stars: ✭ 98 (-6.67%)
Mutual labels: responsive
Bootstrap4 Fs Modal
A simple way to improve UX of Bootstrap 4 modals on mobile phones.
Stars: ✭ 102 (-2.86%)
Mutual labels: responsive
Rxviz
Rx Visualizer - Animated playground for Rx Observables
Stars: ✭ 1,471 (+1300.95%)
Mutual labels: svg
Imgnotes
Extension of the jQuery imgViewer plugin to add markers and notes to the image
Stars: ✭ 98 (-6.67%)
Mutual labels: responsive
I7j Pdfhtml
pdfHTML is an iText 7 add-on for Java that allows you to easily convert HTML and CSS into standards compliant PDFs that are accessible, searchable and usable for indexing.
Stars: ✭ 104 (-0.95%)
Mutual labels: svg
Svg Path Editor
Online editor to create and manipulate SVG paths
Stars: ✭ 1,350 (+1185.71%)
Mutual labels: svg
Processing Svg Experiments
Some Processing example projects to export SVGs
Stars: ✭ 101 (-3.81%)
Mutual labels: svg
Mapify
Responsive and stylable image maps using jQuery, SVG and CSS3
Stars: ✭ 100 (-4.76%)
Mutual labels: responsive
Openmoji
Open source emojis for designers, developers and everyone else!
Stars: ✭ 1,380 (+1214.29%)
Mutual labels: svg
react-native-responsive-linechart
Announcing v5
Breaking changes with respect to v4:
- New dependency on
react-native-gesture-handler
Breaking changes with respect to v3:
- Support for data point visualizations
- Library supplied tooltip component is renamed from
BoxTooltipto justTooltip - Minor theme changes (box -> shape rename)
Additional features:
- Scrollable charts!
View installation docs & examples here
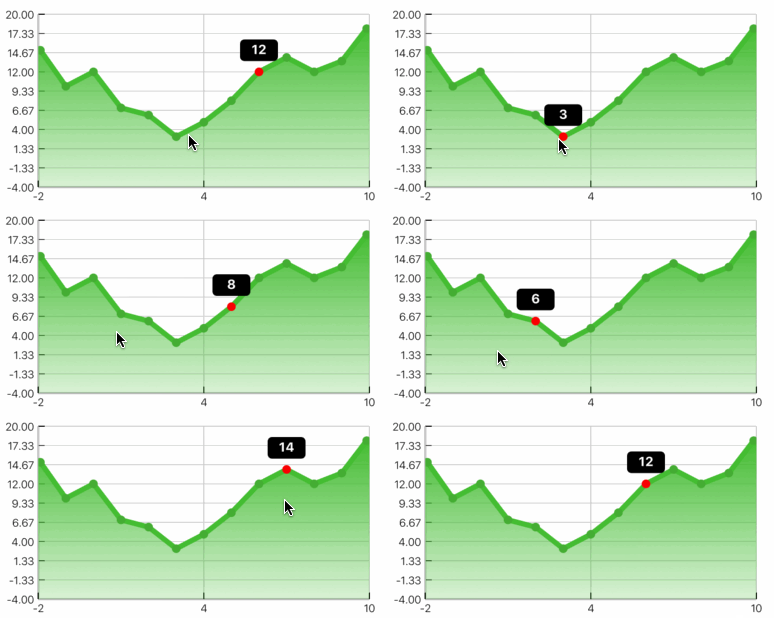
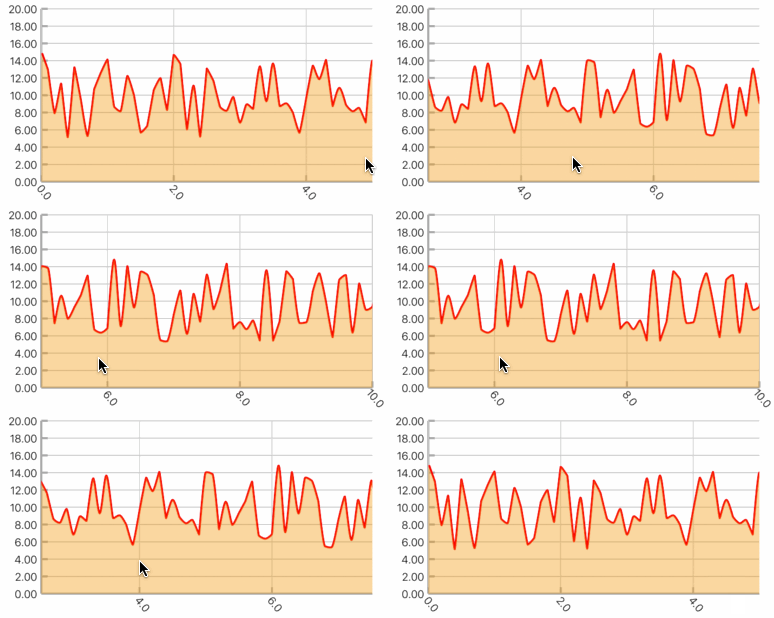
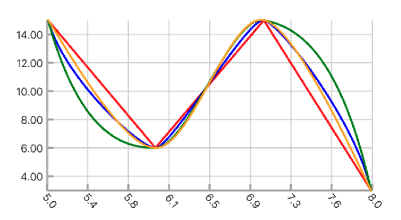
Screenshots
Quick example
import { Chart, VerticalAxis, HorizontalAxis, Line } from 'react-native-responsive-linechart'

<Chart
  style={{ height: 200, width: '100%', backgroundColor: '#eee' }}
  xDomain={{ min: -2, max: 10 }}
  yDomain={{ min: -2, max: 20 }}
  padding={{ left: 20, top: 10, bottom: 10, right: 10 }}
>
  <VerticalAxis tickValues={[0, 4, 8, 12, 16, 20]} />
  <HorizontalAxis tickCount={3} />
  <Line data={data1} smoothing="none" theme={{ stroke: { color: 'red', width: 1 } }} />
  <Line data={data2} smoothing="cubic-spline" theme={{ stroke: { color: 'blue', width: 1 } }} />
</Chart>

const data1 = [
  { x: -2, y: 1 },
  { x: -1, y: 0 },
  { x: 8, y: 13 },
  { x: 9, y: 11.5 },
  { x: 10, y: 12 }
]

const data2 = [
  { x: -2, y: 15 },
  { x: -1, y: 10 },
  { x: 0, y: 12 },
  { x: 1, y: 7 },
  { x: 8, y: 12 },
  { x: 9, y: 13.5 },
  { x: 10, y: 18 }
]
[OLD] Announcing v3
Version 3 is a complete re-write from the ground up with the following exciting features:
- Completely written in Typescript
- Composable API, every part of the chart is its own component.
- Very few dependencies (Total package size is only 62 kilobytes)
- New documentation website with extensive examples
- Support for smooth/linear line & charts area charts, tooltips and more
Due to the nature of the changes, version 2.2 and below is now no longer supported. You can find the old README here.
Note that the project description data, including the texts, logos, images, and/or trademarks,
for each open source project belongs to its rightful owner.
If you wish to add or remove any projects, please contact us at [email protected].


