blitzcode / Rsvp
Labels
Projects that are alternatives of or similar to Rsvp
rsvp - Realtime Sampling Visual Profiler
This repository contains the source code for rsvp, a profiling tool for OS X.
Index
- What is it?
- What it is not...
- System requirements
- Building the profiler
- Preparing your program
- Running
- User interface
- Integrating rsvp with your application
- Bugs
- FAQ
- TODO
- Legal
- Author
What is it?
Rsvp provides function and source level profiling with call tree analysis for C, C++ and Objective-C programs. It also monitors things like memory allocations, disk I/O and thread scheduling to give you a more complete picture.
Data capturing, analysis and display is happening in realtime, making rsvp especially suited for dynamic and interactive applications (think games or GUI ones in general). Its own GUI has a fast keyboard interface and makes efficient use of screen space. Many times just glancing at rsvp while interacting with your application will reveal useful information.
The code is small (less than 5000 lines) and under a very liberal license. If you always want to have access to profiling information, it is easy to integrate and distribute with your project.
What it is not...
You won't get low-level CPU counters like branch prediction failures, there's no cache hierarchy simulation or anything like that, it won't be of much use for MPI programs, doesn't do any instrumentation of the application's executable, no assembler-level analysis, lacks special profiling features for APIs like OpenGL, can't do system profiling like networking analysis etc.
For these features you'll have to continue to rely on other profilers like Valgrind, DTrace, VTune, gprof and VampirTrace. Also, rsvp is currently fairly spartan in its feature set, providing only the minimum functionality I require in a profiler of its kind.
If all this didn't scare you off and a lean & immediate realtime profiling tool sounds just like what you need, please read on & happy profiling!
System requirements
OS X versions 10.6 through 10.10 are currently supported, 10.11 might work. Development tools need to be installed for building and profiling.
Building the profiler
Compiling has no prerequisites aside from Apple's command line development tools and should succeed with a simple
$ make
in the source directory. You should have a rsvp executable after a few seconds. You might want to copy or soft-link the executable somewhere in your path like /usr/bin.
Preparing your program
While rsvp can tell you something about nearly every natively compiled program running on your machine, a few simple changes to your program's build process could significantly improve the accuracy and types of information available.
Most important is compiling with debug symbols, switched on with -g for the gcc and clang compilers.
For capturing information about the program's call tree rsvp depends on the presence of frame pointers, which many modern compilers switch off by default for a (usually) small performance boost. Enabling them with -fno-omit-frame-pointer will allow rsvp (and many other profiling / diagnostic tools) to display call tree related information.
Using -fno-inline (or related flags like -fno-optimize-sibling-calls and -fno-inline-functions-called-once) might further improve symbol resolution and stack traces at the expense of reduced and / or skewed performance.
For source and line-level information access to the object files or a .dSYM directory generated by dsymutil is required (see this Stack Overflow answer for a good explanation why this is the case). Simply invoking it like this should do the job:
$ dsymutil a.out
Rsvp uses the atos system utility to obtain function / method as well as source file and line information. If you're having trouble with rsvp showing unknown symbols or missing line-level information, it might be easier to debug the issue with the atos utility directly. If it can locate and use your program's debug information, so can rsvp.
Running
Rsvp needs to run as root to allow it the level of access required to inspect your program. It attaches to the running process you want to profile, either with a PID like this
$ ps -A | grep Firefox
92391 ??       176:00.96 /Applications/Firefox.app/Contents/MacOS/firefox -foreground
96394 ttys004    0:00.00 grep Firefox

$ sudo rsvp 92391
or simply with a process name
$ sudo rsvp Firefox
Launching rsvp on the process consuming the most CPU resources can be done with a small pipeline
$ ps -r -A -o pid | tail -n +2 | head -n 1 | xargs sudo rsvp
If you want source and line-level information you need to run dsymutil once on your compiled program as explained in the Preparing your program section. If you want to see excerpts from your source code inside of rsvp, you might need to help it locate your source files with the RSVP_SRC_PATH environment variable. By default rsvp will look in the program executable directory only. Keep in mind that programs launched through sudo do not inherit this environment variable by default. You might want to launch rsvp like this:
$ sudo RSVP_SRC_PATH=./src:./src/core:./src/util rsvp ./a.out
Relative paths are interpreted as relative to the executable.
If you have a simple program where the executable as well as the object and source files are in a single location, you can skip the dsymutil and environment variable steps.
Because rsvp uses the atos system utility, you'll need to install Apple's development tools on any system you want to profile on.
User interface
This section contains a full walkthrough of all profiler displays and how to interpret and configure them. The profiler has no mouse driven UI elements and all interaction is through keyboard shortcuts. In the UI shortcuts are shown as keys in brackets, like [A]. When a key controls a quantity, pressing that key increases it while Shift and the key will decrease it.
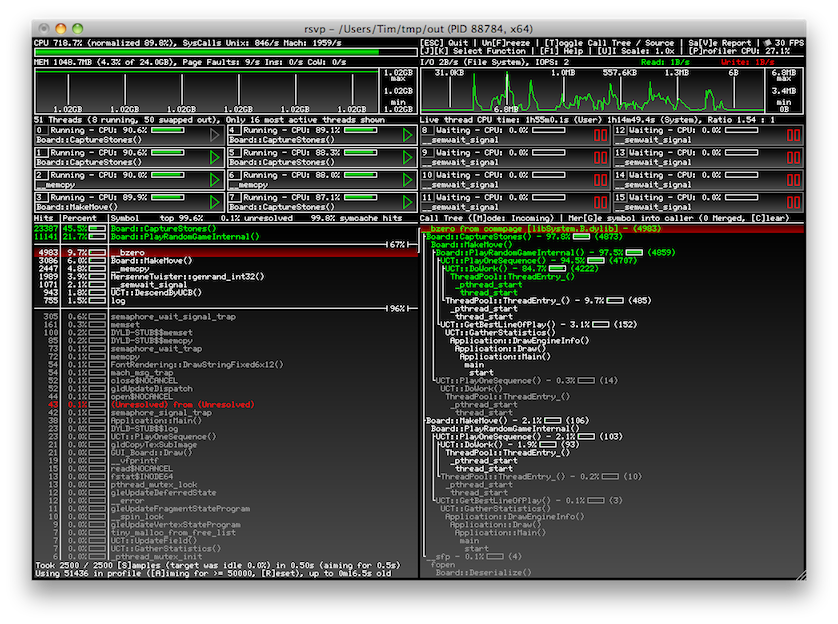
Let's have a look at the entire UI again:
We'll be going through the displays top to bottom.
Title bar
The title bar lists the target program's full executable path, PID and architecture. It's a good idea to double check if you got the right process when the profiler was invoked with a program's name. The green button will maximize the vertical height of the profiler window and move it to the top left.
CPU usage meter
On the top left you'll find the following display:

The large meter is the total CPU usage of all threads in your programs, above you have it spelled out as unnormalized (100% is one CPU core) and normalized (100% is all CPU cores) percentages. The number of system calls per second is also displayed. This can be an indicator for your program doing mostly number crunching or doing a lot of activity like I/O, memory operations, synchronization etc.
Profiler status and shortcut display
Right next to the CPU usage meter you'll find this display:

It shows a number of keyboard shortcuts. We'll discuss some later in the appropriate sections, but here's a list of global ones:
-
ESCexits the profiler (standardCMD+Qalso works) -
Ffreezes and unfreezes the data collection, allowing close examination of profile displays without having them update -
Vsaves a (crude) text report of the current profile data (watch the terminal for the file name) -
F1brings up this web page -
Ucycles through a few different UI scaling factors,SHIFT+Ucycles backwards
-
Popens another profiler instance profiling the current one
There's also a frame rate display and an activity indicator (spinning cube) and a CPU usage percentage. Those are mostly for optimizing GUI responsiveness and sampling efficiency in the profiler itself.
Memory graph
This display gives insight into your program's memory allocation and paging behavior.
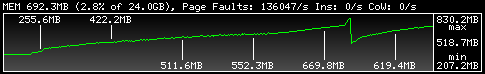
The header line shows the amount of resident memory allocated by your program and how this relates to the total physical memory available to the system. Shown right after it is the number of page faults, page-ins (swapped out data read back from disk) and copy-on-write faults, all given per second.
The graph displays the resident memory usage over time, each pixel representing 1/10 of a second and the entire width of the graph showing the last ~43 seconds.
I/O graph
To the right of the memory graph is the I/O graph. This display shows the disk I/O usage of your program.
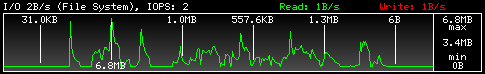
The header line gives read, write and combined I/O bandwidth per second caused by your program. IOPS is the number of I/O system calls made per second, including calls like lseek that might not cause actual disk activity. The graph has the same update rate and time scale as the memory graph.
I/O profiling requires the kdebug trace facility, which can only be used by a single process at a time. If you're running another profiler instance or another program using it, you'll see this error message:
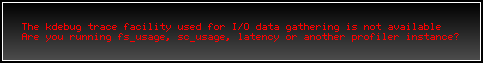
Note that a bug in in the profiler could leave a dangling fs_usage usage process around. A simple
$ sudo killall fs_usage
should fix it and make I/O profiling available again.
Thread display
Below the memory and I/O graphs is the thread display, showing what your program's sixteen most busy threads are up to.
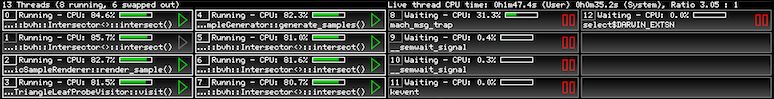
The header line gives some statistics, as well as the user / system time:


The latter can be used to determine the overall CPU usage through the lifetime of the program as well as the ratio of time spend in system calls versus user code.
The actual threads are displayed in 16 slots, going top to bottom and left to right:
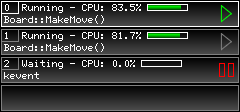
Let's look at how to read the information in each individual slot. The top line shows the thread's status (Running, Stopped, Waiting, NoIntWait or Halted) and its CPU usage (where 100% means fully occupying one core). The icon on the right is quick visual indicator of the status. The bottom line shows the function / method which the thread was executing when the status information was collected. A grayed out frame and icon means the thread is swapped out, meaning it is ready to execute but not running on any physical core.
All status information is updated twice a second, while the CPU usage value is updated ten times a second. This is unrelated to any other data collection activity and only done to have the displays remain static long enough to be readable at a glance. Note that a slot or thread number does not represent any individual thread, but just the thread currently sorted to be the Nth busiest thread by CPU usage.
Function profile
In this display you can see a list of functions / methods sorted by their contribution to your program's CPU usage. The hit count / percentage does not include descendants (the outgoing call tree shows those), unless you explicitly merged them. Symbol names are simplified to exclude template or function parameters.
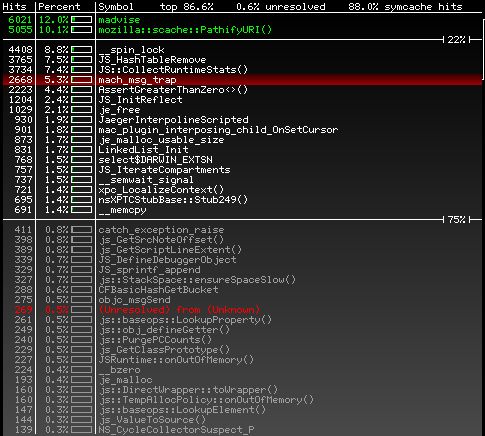
The list is grouped into green (>= 10% contribution), white (>= 1% contribution) and grey (< 1% contribution) entries. Between those groups is a separator line and percentage figure with the sum of all entries above it. The 'top' figure in the header further displays the sum of all functions currently visible in the table.
Unresolved symbols are displayed in red as '(Unresolved) from (Unknown)'. Sometimes at least the module of origin is known. In this case an entry of i.e. '(Unresolved) from a.out' might indicate missing debug information in your program. The 'unresolved' figure in the header is a sum of all unresolved symbol groups. See the Preparing your program section on how to avoid unresolved symbols.
J / K or the arrow keys can be used to move the red selection marker to a different function. A line links up the selection to a secondary display to the right of the function profile, providing further information. You might want to freeze data collection with F while moving the selection and inspecting the displays.
Sampling configuration
At the bottom of the function profile sits the sampling statistics and configuration display:

The display might look confusing at first, but correctly interpreting and configuring it is essential for successful profiling with rsvp.
The first line is related to each sample run. Rsvp aims to collect a fixed amount of samples from your program over a half-second interval. If your program is idle when a sample is taken, no data can be collected and the run will be smaller. If sampling is too expensive, the half-second interval can be exceeded and updating slows down. Programs with very deep call stacks can be expensive to sample. Another source of slowdown can be a large number of idle threads, as the profiler might have to look at many threads before finding a running one. With S or SHIFT+S the number of sampling attempts over each half-second interval can be increased / decreased. Increase it if you want the profiler to capture accurate information faster, decrease it if the interval time or the profiler CPU usage (status display in the top right corner) indicate a too high overhead from sampling.
The second line relates to the accumulated samples from each run used for the actual profile. The profiler will add up sample runs until the target number of samples is reached, retiring old runs as new ones become are available. Since runs are merged in their entirety, the target number of samples can be exceeded. Press A or SHIFT+A to increase / decrease the target number of samples (also called sampling window). A larger amount of samples increases accuracy at the expense of responsiveness of the profile. A small amount of samples in the profile makes the profiler show changes in the program's execution faster at the expense of stronger fluctuations and potential omissions from the profile. The amount of samples taken and the age of the data from the oldest run used is displayed. Press R to discard all samples taken so far. A situation where this can be helpful is a program that just switched from a very busy stage to a mostly idle one. It could take a long time for the few samples collected from the now idle program to push out the ones collected during the more busy period. Resetting the profile immediately makes the profiler show only data from the current state.
A few examples to clarify the above. If you want to profile a program with a fairly constant execution profile and have as little sampling impact as possible, use a large sampling window and a low collection count for each run. If you instantly want to see changes in the profile i.e. from grabbing a scrollbar in the UI or changing view in a 3D application, use a small sampling window and a high collection count. If you want accuracy and responsiveness, increase both at the expensive of sampling overhead. If you need neither, decrease both for low sampling and processing overhead.
Call tree (incoming)
By default, the panel on the right of the function profile displays the incoming call tree of the selected function.
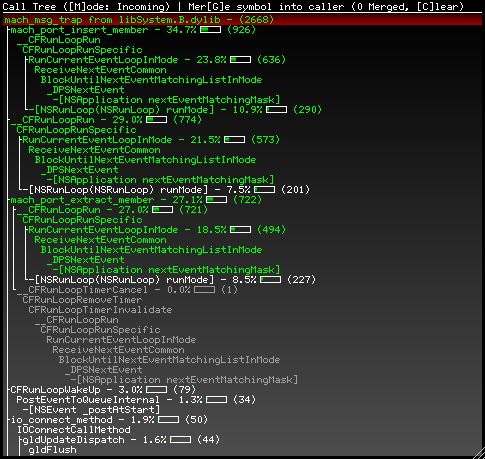
The incoming tree shows how the selected function is being invoked. The red highlighted line repeats the function name and hit count from the function profile, but also shows its module name. The percentage is proportional to the total time spend in the top function in which the call came through that line. This means it doesn't show the number of calls, but the actual CPU usage for which that path through the call tree is responsible. If no percentage is given, it can be inferred to be 100% of its parent. Connecting lines are omitted for the common single child case. The coloring is based on the same >= 10%, >= 1% and < 1% thresholds as in the function profile. Unresolved symbols are also colored red.
The top right corner of the call tree panel shows information about function merging:

Pressing G will remove the selected function from the function profile and call tree while merging its contribution into the parents (callers). The impact on the profile result is similar to having the function inlined at compile time. Merging functions is useful to i.e. get rid of library functions like fcos that can't be changed, unknown symbols from a library where debug information is unavailable, or simply plumbing functions cluttering up the profile. Pressing C will revert and stop merging any functions. The merging process happens during data collection, and any changes to the merged function list will cause the current profile data to be cleared. A good strategy is to freeze the data collection with F, tag all functions which should be merged, then unfreeze and wait for the new merged results to accumulate. Functions can't be merged if they are an entry point or call stack information is not available, and they will continue to show up in the profile.
If rsvp can't capture / traverse your call stacks, the following warning is shown at the bottom of the call tree display:

Please see the Preparing your program section on how to fix this.
Call tree (outgoing)
Pressing M switches the call tree into outgoing mode and back.
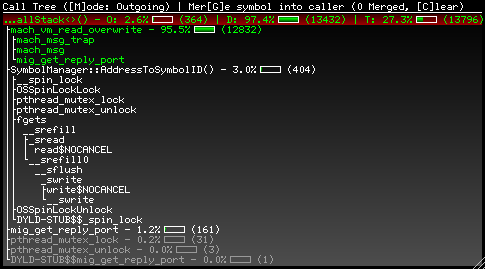
The outgoing tree shows the functions invoked from the selected one. A hit count and percentage is displayed for the directly called (first level) functions. The percentage is based on how much time is spend in the called function and its descendants relative to all functions called from the selected one. As an example, a value of 25% for function A would mean a quarter of the time spend in the entire outgoing call tree was spend in A and its descendants. There is no further statistics for the subtree of a direct callee, and its coloring is solely based on the first level function.
The red highlighted line repeats the selected function name and shows three sample counts:
- O wn - The number of samples recorded for the selected function itself. The percentage shows the contribution to the total (own + descendants) sample count.
- D escendants - The number of samples recorded for the entire outgoing call tree of the selection function (all of its descendants). The percentage shows the contribution to the total (own + descendants) sample count.
- T otal - The total number of samples recorded for the selected function and all of its descendants. The percentage shows the total (inclusive) contribution to the function profile.
The outgoing tree in the picture above shows a function where 97.4% of the total time is spend in the descendant functions, and 95.5% of that time goes through a function called mach_vm_read_overwrite. The selected function itself only contributes 2.6%. The total contribution to the function profile of the selected function and all its descendants is 27.3%.
Source view
Pressing T switches the call tree into the source view and back. Here the currently selected function is broken up into its busiest source code lines.
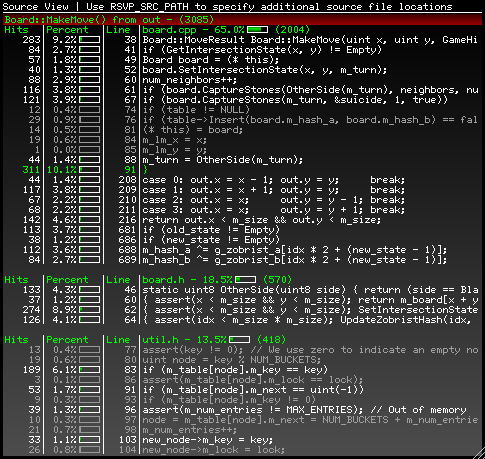
The entries in the table are sorted by file and then source line top to bottom (not by hit percentage). Hits in header files are likely functions inlined into the current one. Hits attributed to closing braces } are likely for time spent in destructors. Note that heavy compiler optimization can reduce the accuracy of address-to-line mappings from the debug information. The coloring of entries is based on the same percentage thresholds as all previous displays.
If rsvp can't resolve line-level information for the current function, the following warning is displayed at the bottom of the source view display:

Please see the Preparing your program section on how to fix this. If line-level information is available but no excerpts from your code are shown, see Running on how to tell rsvp where to find your source files. Note that line-level sampling failures from merged children are propagated, so if you merge a system call lacking such debug information this warning may show up for an otherwise fine function of yours.
Integrating rsvp with your application
The profiler itself can be profiled by simply pressing P. Maybe you'd like a convenient way to invoke rsvp from your application as well, always having profiling available with a single shortcut or menu selection. Invoking the profiler executable with the PID of your process should be trivial, but you might have an issue with rsvp requiring root privileges to run. The following C code snippet will fix this issue by prompting the user for the administrator password (if you're not already running as root) and then execute rsvp on the current process.
#include <Security/Security.h> // -framework Security
#include <stdio.h>
#include <unistd.h>

void InvokeRSVP()
{
    AuthorizationRef authRef;
    OSStatus status = AuthorizationCreate(
        NULL,
        kAuthorizationEmptyEnvironment,
        kAuthorizationFlagDefaults,
        &authRef);
    if (status == errAuthorizationSuccess)
    {
        char pid_buf[32];
        snprintf(pid_buf, sizeof(pid_buf), "%i", (int) getpid());
        const char * const argv[] = { pid_buf, NULL };
        status = AuthorizationExecuteWithPrivileges(
            authRef,
            "rsvp",
            kAuthorizationFlagDefaults,
            (char * const *) argv,
            NULL);
        AuthorizationFree(authRef, kAuthorizationFlagDestroyRights);
    }
}
Note that while the above code should work on all systems supported by rsvp, the AuthorizationExecuteWithPrivileges API is considered deprecated since 10.7.
If you don't want to modify your program, you can achieve something similar with a little AppleScript and Automator trickery. This short script will invoke rsvp on the current foreground application:
tell application "System Events"
    set app_name to name of the first process whose frontmost is true
    do shell script "rsvp " & app_name with administrator privileges
end tell
You can turn this script into a system service by creating one inside of Automator and have it run the snippet above:
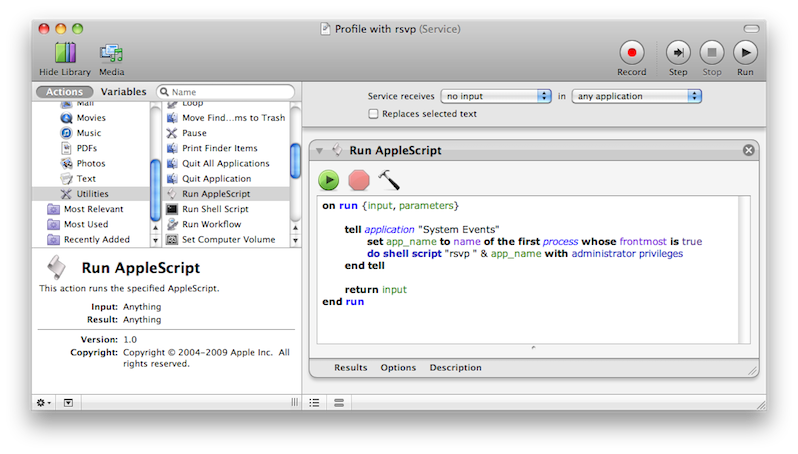
Now, invoking rsvp on the current application will be available from the 'Services' menu. If you like, you can also assign a shortcut to it in the keyboard preferences.
Bugs
Please contact me if you're encountering a bug when building or profiling. Also reports on errors in this document are appreciated.
FAQ
Porting to Windows / Linux?
Rsvp is currently only available on OS X because that's what I used the most when I wrote it. The OS and CPU specific data gathering code is largely independent of the portable remainder, and rewriting it for other platforms should be quite feasible. For Windows I'd look at CreateRemoteThread, SuspendThread, GetThreadContext, ResumeThread, StackWalk64 and the Sym* functions from DbgHelp. For Linux I'd look at the ptrace system call and the addr2line utility.
What's with the strange UI?
I actually like the look and feel of the simple OpenGL + keyboard controls only interface. A less subjective reason is that I didn't want to tie this rather small program to any large GUI toolkit or use anything platform dependent. The user interface code is fairly independent of the actual profiler, doing a Qt or HTML5 interface should be doable.
TODO
A list of potential future enhancements. No promises or schedule given, and in no particular order. There are also plenty of 'TODO' comments in the source code.
- Profiler currently uses /usr/bin/atos, which is deprecated on 10.9+. The new supported way is invoking atos through xcrun, calling
/Applications/Xcode.app/Contents/Developer/usr/bin/atos. This version of atos unfortunately freezes the target process when invoked in batch mode, making profiling impossible - Varied-pitch font rendering to display symbol names more compact
- Option to let profiler launch the target so we don't miss things which happen at startup
- Command line switch to open window left / right / center
- Keyboard shortcut to maximize / restore window
- Retina display mode (need to tell OS X we want a physical resolution OpenGL frame buffer)
- Better error message when target process exits (currently we assert)
- Option to let the freeze feature also stop the target process
- Disassembly view
- Profiler CPU usage should include atos and fs_usage
- I/O profiling: Option to toggle between disk and network I/O profiling
- I/O profiling: Handle freeze mode with less bogus values in the graph
- I/O profiling: Separate lines in the graph for reads and writes
- Option to toggle source view sorting between line number and percentage
- Cut off source lines with an ellipsis like we do for symbol names
- Scroll bars for function profile / call tree / source view
- Mouse Support: Click on function list, buttons for Quit/Freeze/Save Report, point at graphs etc., ...
- Add 'collapsed' UI mode, only showing the left column
- Option to just sample waiting threads, analysis features to see where / how threads are stalled
- Add horizontal resizing (most elements could stay fixed width, but extra space for function / tree / source view would be nice)
- Ability to take snapshots of ProfileData, either to save to disk or as a history feature
- Having a large number of waiting threads in the target eats up a lot of performance when the profiler tries to find a running thread. Investigate why sampling previously running threads earlier when searching does not seem to help here.
- Better reports, possible XML and HTML output
- Memory allocation profiling, see 'heap' and 'malloc_history' tool
- Investigate TH_STATE_RUNNING vs TH_FLAGS_SWAPPED vs tbi.suspend_count - When is a thread truly stopped, when should we sample it?
- Investigate if the thread suspension in the HF sampling thread for call stack capture has any effect on the thread status display
- Option to toggle between inclusive / exclusive percentages (descendants) in the function profile
- Use a tree cut algorithm to condense call tree to the display area and still show the important parts (also do something similar for the source view)
- Consider adding full call graph processing with collapsing of strongly connected components and a 'critical path' view (see gprof paper), deal with this in incoming and outgoing call trees, when computing descendant time, when merging symbols into their callers etc.
- Option to show both incoming and outgoing calls at the same time
- High profiling overhead is generally caused by deep call stacks or lots of idle threads. Finish the work on TargetPageCache to fix the former, exploit knowledge about thread CPU usage to construct a more efficient sampling scheme fixing the latter
- Move file I/O for source line lookup out of the GUI thread
- Improve the outgoing call tree (currently there's just statistics on the first level of called functions, we can probably be smarter about how all of this is computed and displayed. Also double check the logic of outgoing tree extraction and analysis, it's all somewhat tricky)
- Ability to move the selection over to the call tree and then select a function there, which is then in turn selected in the function profile
- Move symbol merge UI ([G], [C] and merge count) and the [J][K] key description to the function profile, [T] key description into the call tree header. All these things seem to be at the wrong place right now due to screen space reasons
- Shortcut to merge all symbols from outside modules
- Per-thread profiling: Include / exclude threads from the profile, see the profile of only a single thread etc.
- Add 'install' target to the Makefile
- Consider using something like libunwind for more robust stack captures with CFI
- Move the handling of function merging from the capture code to the function profile output code. It requires some additional processing and we need to keep additional information around (like call trees for each sampled source line), but we could merge / unmerge functions without having to reset the profile
- Mark functions receiving contributions from merged children somehow
Legal
This program is published under the MIT License.
Author
Rsvp is developed by Tim C. Schroeder, visit my website to learn more.