All Projects → hijiangtao → Ss Vis Component

hijiangtao / Ss Vis Component

Licence: mit
VIS components for a security system, to monitor the state and confirm the system's health running.

Programming Languages

javascript
184084 projects - #8 most used programming language

Projects that are alternatives of or similar to Ss Vis Component

Just Dashboard
📊 📋 Dashboards using YAML or JSON files
Stars: ✭ 1,511 (+1617.05%)
Mutual labels:  data-visualization, chart, d3js
Sunburst Chart
A sunburst interactive chart web component for visualizing hierarchical data
Stars: ✭ 140 (+59.09%)
Mutual labels:  data-visualization, chart, d3js
Reaviz
📊 Data visualization library for React based on D3
Stars: ✭ 215 (+144.32%)
Mutual labels:  data-visualization, chart, d3js
D3fc
A collection of components that make it easy to build interactive charts with D3
Stars: ✭ 898 (+920.45%)
Mutual labels:  chart, d3js
Party Mode
An experimental music visualizer using d3.js and the web audio api.
Stars: ✭ 690 (+684.09%)
Mutual labels:  data-visualization, d3js
Uplot
📈 A small, fast chart for time series, lines, areas, ohlc & bars
Stars: ✭ 6,808 (+7636.36%)
Mutual labels:  data-visualization, chart
Tui.chart
🍞📊 Beautiful chart for data visualization.
Stars: ✭ 5,041 (+5628.41%)
Mutual labels:  data-visualization, chart
D3 In Motion
Code examples and references for the course "D3.js in Motion"
Stars: ✭ 37 (-57.95%)
Mutual labels:  chart, d3js
Amcharts4
The most advanced amCharts charting library for JavaScript and TypeScript apps.
Stars: ✭ 907 (+930.68%)
Mutual labels:  data-visualization, chart
React Vis
Data Visualization Components
Stars: ✭ 8,091 (+9094.32%)
Mutual labels:  data-visualization, chart
D3
This is the repository for my course, Learning Data Visualization with D3.js on LinkedIn Learning and Lynda.com.
Stars: ✭ 64 (-27.27%)
Mutual labels:  data-visualization, d3js
Bizcharts
Powerful data visualization library based on G2 and React.
Stars: ✭ 5,771 (+6457.95%)
Mutual labels:  data-visualization, chart
Gojs
JavaScript diagramming library for interactive flowcharts, org charts, design tools, planning tools, visual languages.
Stars: ✭ 5,739 (+6421.59%)
Mutual labels:  data-visualization, chart
D3 Timeline
A simple D3 Timeline chart
Stars: ✭ 743 (+744.32%)
Mutual labels:  chart, d3js
Clip
Create charts from the command line
Stars: ✭ 5,111 (+5707.95%)
Mutual labels:  data-visualization, chart
Reasonbizcharts
ReasonML binding for BizCharts https://bizcharts.net/products/bizCharts/demo
Stars: ✭ 23 (-73.86%)
Mutual labels:  data-visualization, chart
Chart
Create the most popular types of charts by real or random data
Stars: ✭ 1,101 (+1151.14%)
Mutual labels:  data-visualization, chart
Three Forcegraph
Force-directed graph as a ThreeJS 3d object
Stars: ✭ 84 (-4.55%)
Mutual labels:  data-visualization, d3js
Ac D3
Javascript Library for building Audiovisual Charts in D3
Stars: ✭ 76 (-13.64%)
Mutual labels:  data-visualization, chart
Antd Umi Sys
企业BI系统,数据可视化平台,主要技术:react、antd、umi、dva、es6、less等,与君共勉,互相学习,如果喜欢请start ⭐。
Stars: ✭ 503 (+471.59%)
Mutual labels:  data-visualization, d3js

ss-vis-component

VIS components for a security system, to monitor the state and confirm the system's health running. All codes were wrote based on D3.js version 3.x.

Introduction

This is a demo project of my work about how to visualize charts with pure d3. Current pages are loaded from one js file integrateIndex.js, all initialize, update and fake data generating methods are included.

Each type of chart include generate and redraw methods, all 11 types of charts are defined in methods of Vue defining part. I will extract them out and then explain them briefly if someone are interested in this work.

Component Methods

Sensor Memory Monitor (Single Area Chart)

For example, you can find the function below in the file can use it to create a new instance.

function displayMem()

For complete usage of all kinds of charts, please see the complete Docs.

DEMO

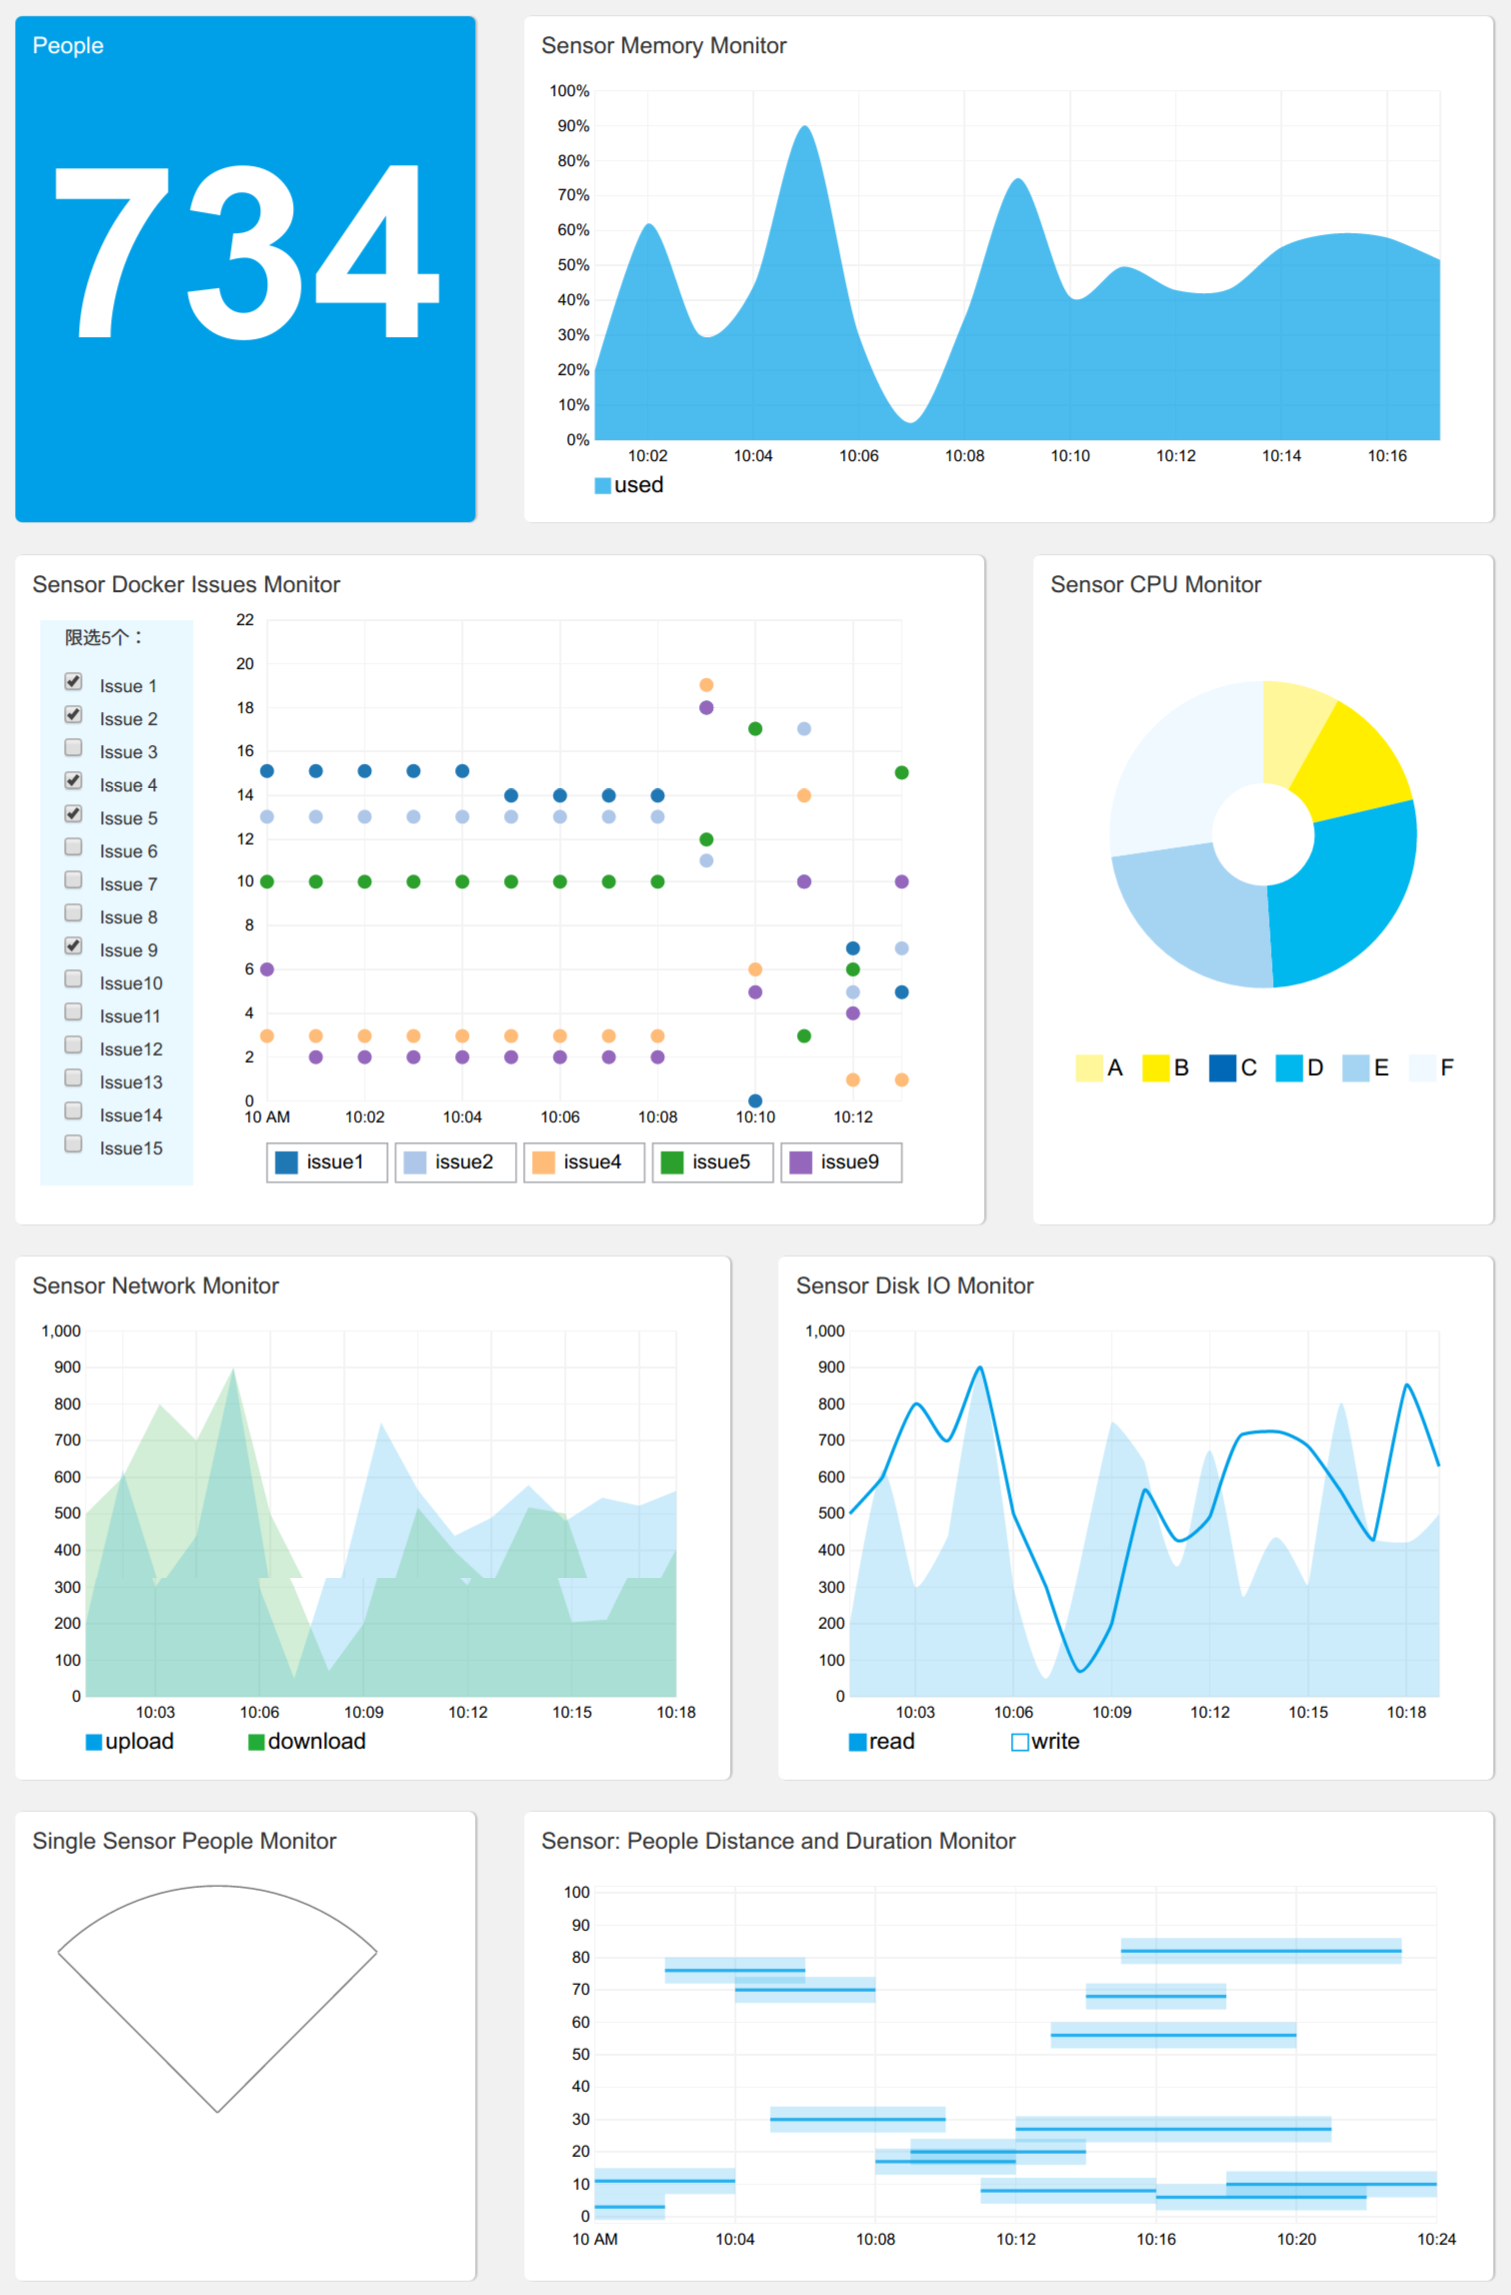
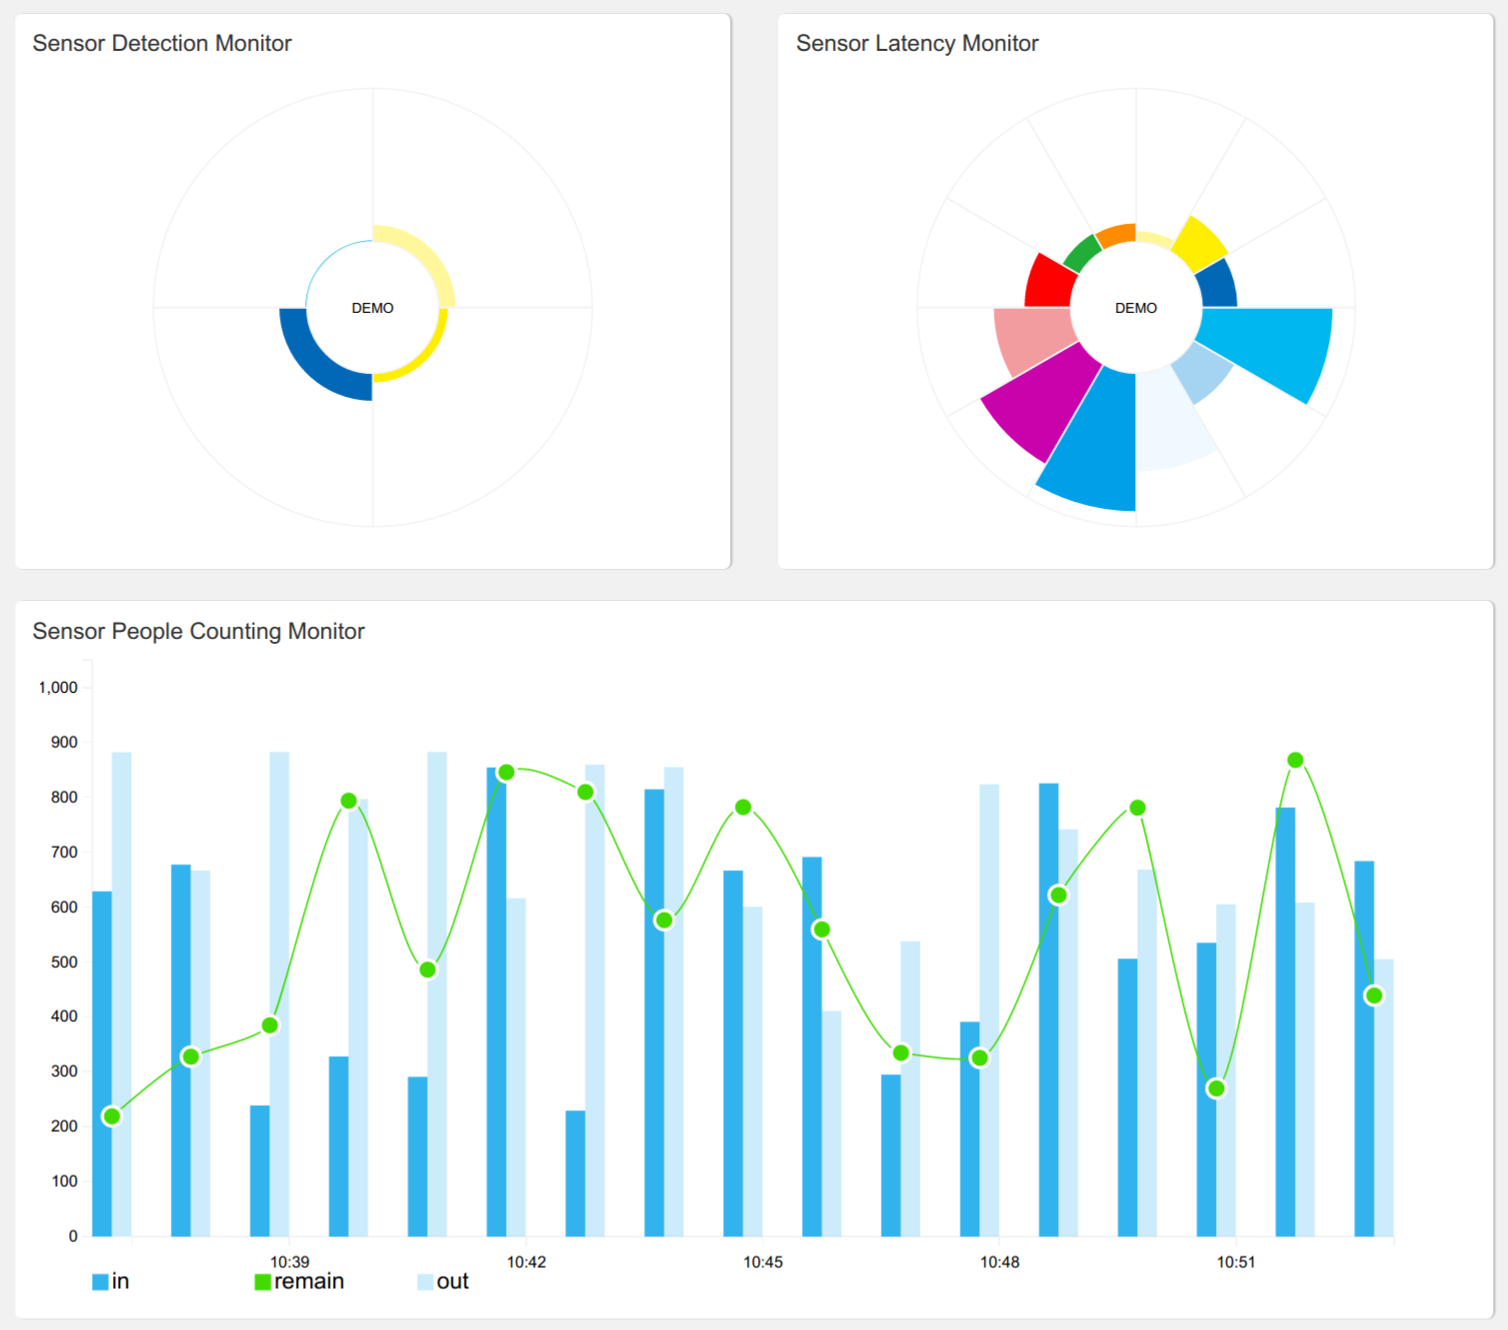
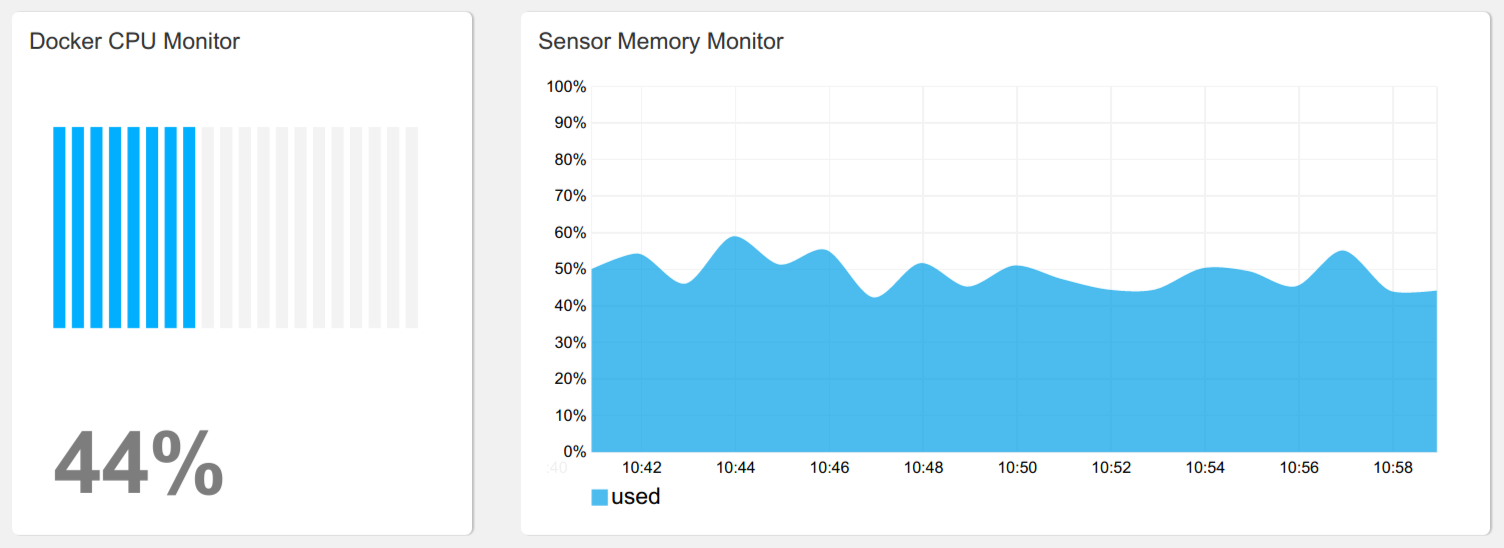
Here are some pictures of the running cases, includes both visualization cards, charts and customized monitor map. See more examples at here.

DEMO 1

DEMO 2

DEMO 3

Remaining BUGS

When some extra dots in charts (line chart / area chart) are removed from the svg, the tooltips of remaining dots seems to point false info in its secondary dot (Two dots will exist in one x-axis, such as the write and read dots in charts. For the development of showing different dots' tooltip, we call one dot is chief one while another's secondary). I found it is the updating codes' running order in d3 that causes the problem. Since I am now busy with other thing, I will not fix the display bugs in time, but it's welcomed for you to report the fixing methods.

Contribute

Welcome to open issues and tell me your wonderful ideas.

LICENSE

MIT

Joe Jiang

2017.2

Note that the project description data, including the texts, logos, images, and/or trademarks, for each open source project belongs to its rightful owner. If you wish to add or remove any projects, please contact us at [email protected].