robcowart / Synesis_lite_suricata
Programming Languages
Projects that are alternatives of or similar to Synesis lite suricata
sýnesis™ Lite for Suricata
![]()
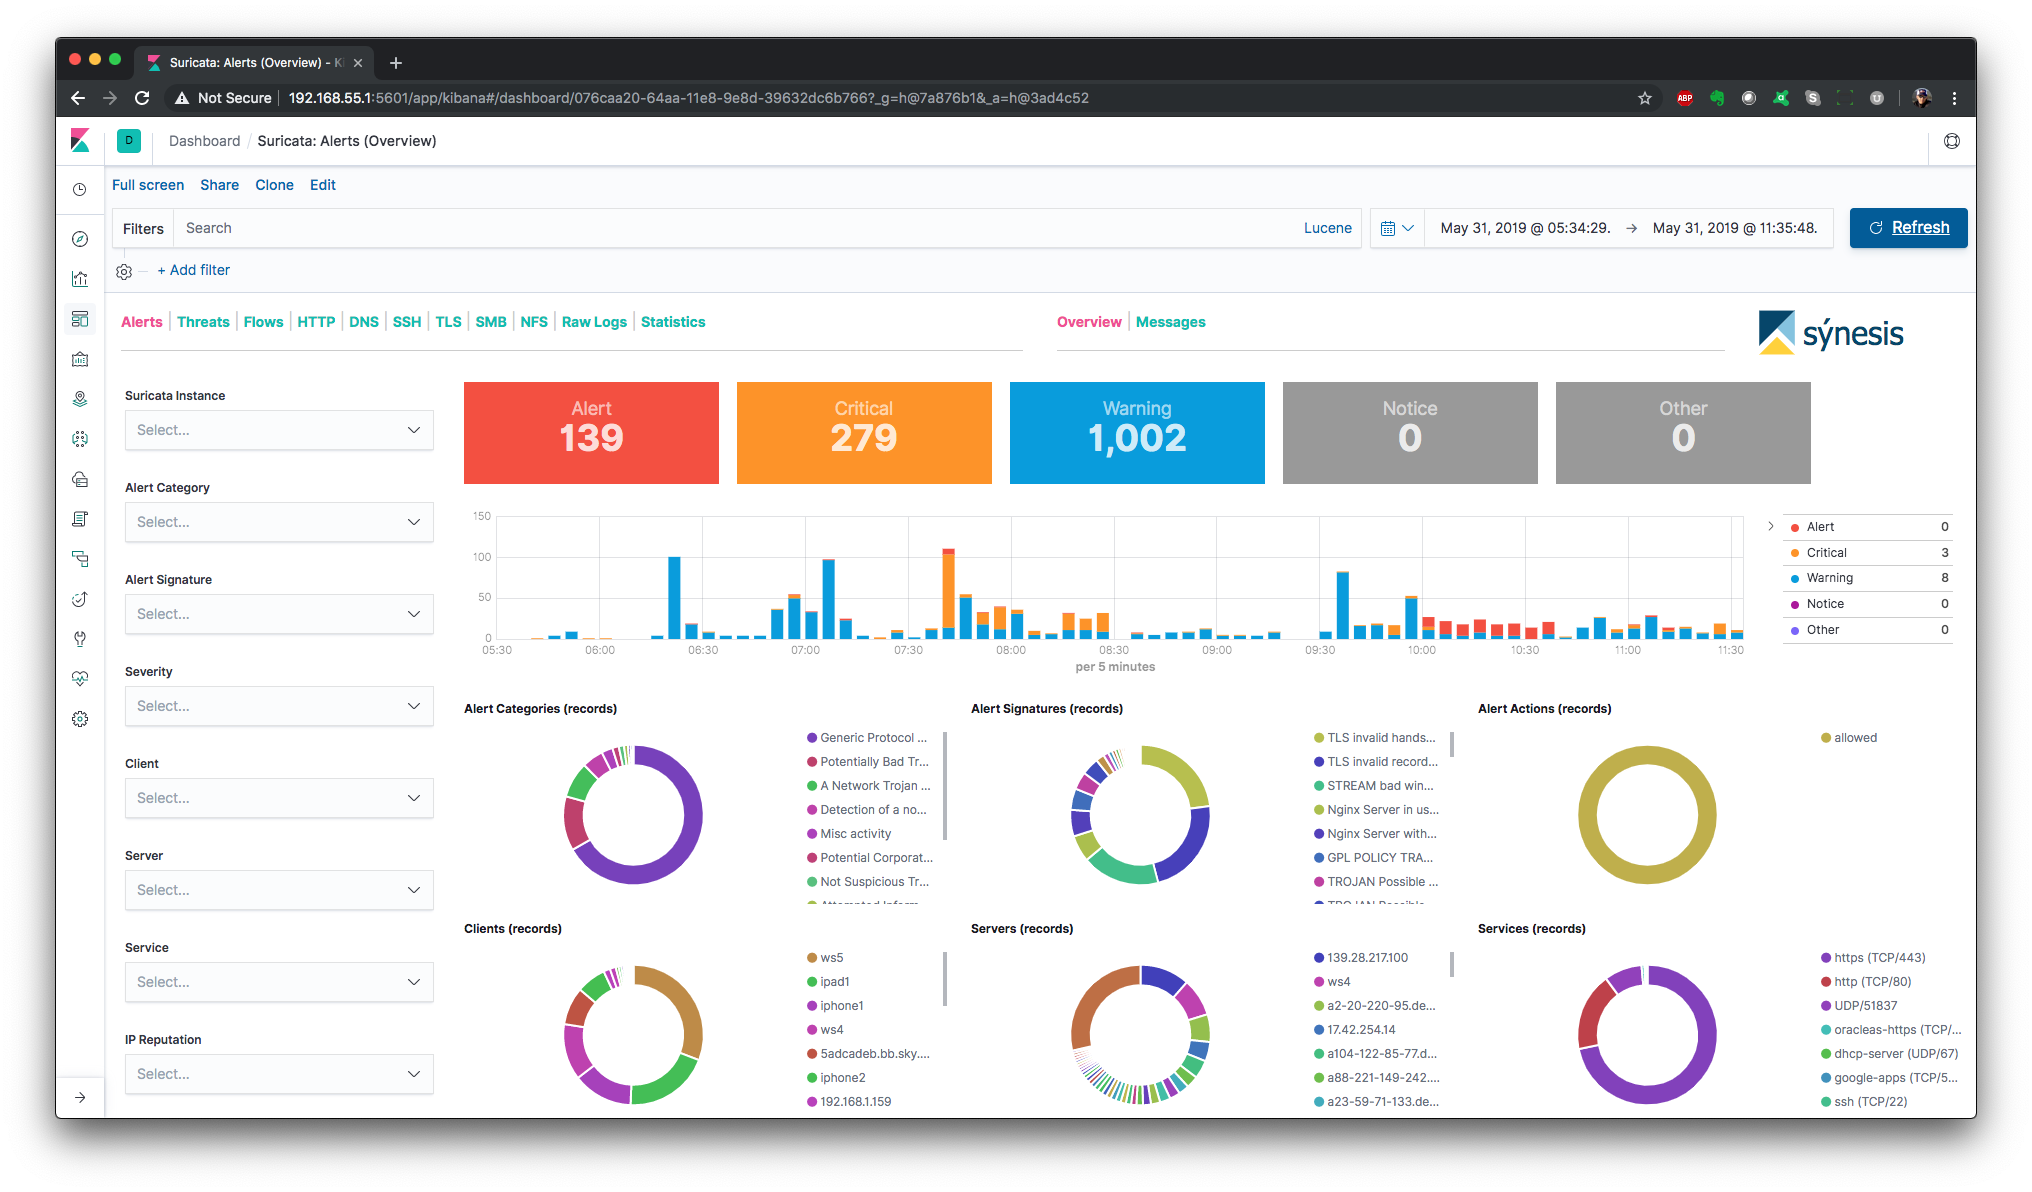
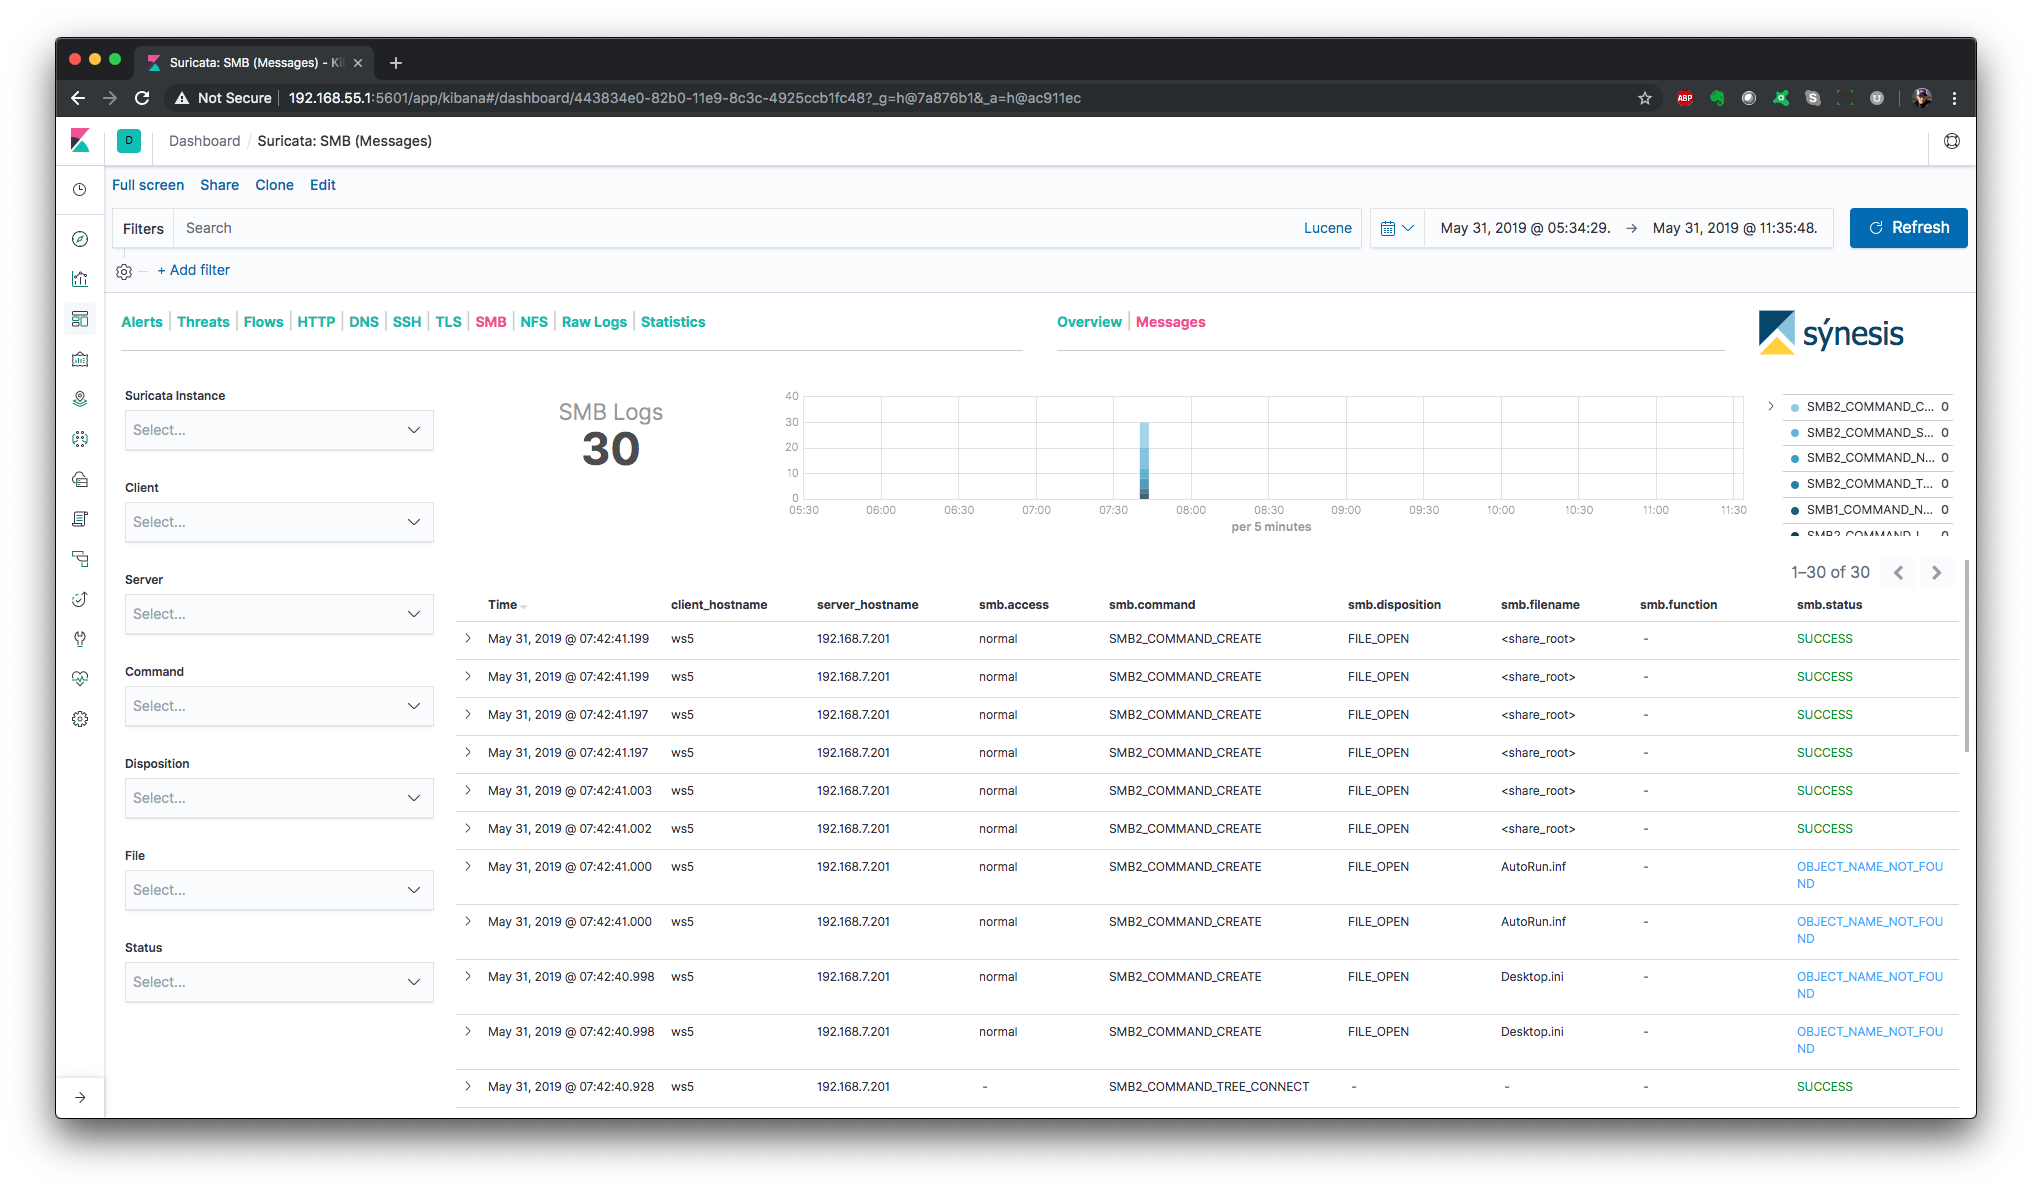
sýnesis™ Lite for Suricata provides basic log analytics for Suricata IDS/IPS using the Elastic Stack. It is a solution for the collection and analysis of Suricata "eve" JSON logs. This includes alerts, flows, http, dns, statistics and other log types.

Getting Started
sýnesis™ Lite for Suricata is built using the Elastic Stack, including Elasticsearch, Logstash and Kibana. To install and configure sýnesis™ Lite for Suricata, you must first have a working Elastic Stack environment. The latest release requires Elastic Stack version 6.2 or later.
Refer to the following compatibility chart to choose a release of sýnesis™ Lite for Suricata that is compatible with the version of the Elastic Stack you are using.
| Elastic Stack | Release |
|---|---|
| 7.1.x | ✓ (v1.1.0) |
| 7.0.x | ✓ (v1.1.0) |
| 6.x | ✓ (v1.0.1) |
Suricata
Suggested configurations for the Suricata eve log output, and app_layer protocols is provided in the files found in the suricata directory.
Setting up Elasticsearch
Previous versions of the Elastic Stack required no special configuration for Elasticsearch. However changes made to Elasticsearch 7.x, require that the following settings be made in elasticsearch.yml:
indices.query.bool.max_clause_count: 8192
search.max_buckets: 250000
At high ingest rates (>5K logs/s), or for data redundancy and high availability, a multi-node cluster is recommended.
If you are new to the Elastic Stack, this video goes beyond a simple default installation of Elasticsearch and Kibana. It discusses real-world best practices for hardware sizing and configuration, providing production-level performance and reliability.

Additionally local SSD storage should be considered as mandatory! For an in-depth look at how different storage options compare, and in particular how bad HDD-based storage is for Elasticsearch (even in multi-drive RAID0 configurations) you should watch this video...

Filebeat
As Suricata is usually run on one or more Linux servers, the solution includes both Filebeat and Logstash. Filebeat is used to collect the log data on the system where Suricata is running, and ships it to Logstash via the beats input. An example Filebeat log input configuration is included in filebeat/filebeat.yml.
Setting up Logstash
The sýnesis™ Lite for Suricata Logstash pipeline is the heart of the solution. It is here that the raw flow data is collected, decoded, parsed, formatted and enriched. It is this processing that makes possible the analytics options provided by the Kibana dashboards.
Follow these steps to ensure that Logstash and sýnesis™ Lite for Suricata are optimally configured to meet your needs.
1. Set JVM heap size.
To increase performance, sýnesis™ Lite for Suricata takes advantage of the caching and queueing features available in many of the Logstash plugins. These features increase the consumption of the JVM heap. Additionally the size of the IP reputation dictionary ip_rep_basic.yml can also increase heap usage. The JVM heap space used by Logstash is configured in jvm.options. It is recommended that Logstash be given 4GB of JVM heap. This is configured in jvm.options as follows:
-Xms4g
-Xmx4g
2. Add and Update Required Logstash plugins
Ensure that all Logstash plugins are up to date by executing the following command.
LS_HOME/bin/logstash-plugin update logstash-filter-dns
3. Copy the pipeline files to the Logstash configuration path.
There are four sets of configuration files provided within the logstash/synlite_suricata folder:
logstash
  `- synlite_suricata
       |- conf.d  (contains the logstash pipeline)
       |- dictionaries (yaml files used to enrich the raw log data)
       |- geoipdbs  (contains GeoIP databases)
       `- templates  (contains index templates)
Copy the synlite_suricata directory to the location of your Logstash configuration files (e.g. on RedHat/CentOS or Ubuntu this would be /etc/logstash/synlite_suricata ). If you place the pipeline within a different path, you will need to modify the following environment variables to specify the correct location:
| Environment Variable | Description | Default Value |
|---|---|---|
| SYNLITE_SURICATA_DICT_PATH | The path where the dictionary files are located | /etc/logstash/synlite_suricata/dictionaries |
| SYNLITE_SURICATA_TEMPLATE_PATH | The path to where index templates are located | /etc/logstash/synlite_suricata/templates |
| SYNLITE_SURICATA_GEOIP_DB_PATH | The path where the GeoIP DBs are located | /etc/logstash/synlite_suricata/geoipdbs |
4. Setup environment variable helper files
Rather than directly editing the pipeline configuration files for your environment, environment variables are used to provide a single location for most configuration options. These environment variables will be referred to in the remaining instructions. A reference of all environment variables can be found here.
Depending on your environment there may be many ways to define environment variables. The files profile.d/synlite_suricata.sh and logstash.service.d/synlite_suricata.conf are provided to help you with this setup.
Recent versions of both RedHat/CentOS and Ubuntu use systemd to start background processes. When deploying sýnesis™ Lite for Suricata on a host where Logstash will be managed by systemd, copy logstash.service.d/synlite_suricata.conf to /etc/systemd/system/logstash.service.d/synlite_suricata.conf. Any configuration changes can then be made by editing this file.
Remember that for your changes to take effect, you must issue the command
sudo systemctl daemon-reload.
5. Add the sýnesis™ Lite for Suricata pipeline to pipelines.yml
Logstash 6.0 introduced the ability to run multiple pipelines from a single Logstash instance. The pipelines.yml file is where these pipelines are configured. While a single pipeline can be specified directly in logstash.yml, it is a good practice to use pipelines.yml for consistency across environments.
Edit pipelines.yml (usually located at /etc/logstash/pipelines.yml) and add the sýnesis™ Lite for Suricata pipeline (adjust the path as necessary).
- pipeline.id: synlite_suricata
  path.config: "/etc/logstash/synlite_suricata/conf.d/*.conf"
6. Configure inputs
By default Filebeat data will be recieved on all IPv4 addresses of the Logstash host using the default TCP port 5044. You can change both the IP and port used by modifying the following environment variables:
| Environment Variable | Description | Default Value |
|---|---|---|
| SYNLITE_SURICATA_BEATS_HOST | The IP address on which to listen for Filebeat messages | 0.0.0.0 |
| SYNLITE_SURICATA_BEATS_PORT | The TCP port on which to listen for Filebeat messages | 5044 |
7. Configure Elasticsearch output
Obviously the data needs to land in Elasticsearch, so you need to tell Logstash where to send it. This is done by setting these environment variables:
| Environment Variable | Description | Default Value |
|---|---|---|
| SYNLITE_SURICATA_ES_HOST | The Elasticsearch host to which the output will send data | 127.0.0.1:9200 |
| SYNLITE_SURICATA_ES_USER | The password for the connection to Elasticsearch | elastic |
| SYNLITE_SURICATA_ES_PASSWD | The username for the connection to Elasticsearch | changeme |
If you are only using the open-source version of Elasticsearch, it will ignore the username and password. In that case just leave the defaults.
8. Enable DNS name resolution (optional)
In the past it was recommended to avoid DNS queries as the latency costs of such lookups had a devastating effect on throughput. While the Logstash DNS filter provides a caching mechanism, its use was not recommended. When the cache was enabled all lookups were performed synchronously. If a name server failed to respond, all other queries were stuck waiting until the query timed out. The end result was even worse performance.
Fortunately these problems have been resolved. Release 3.0.8 of the DNS filter introduced an enhancement which caches timeouts as failures, in addition to normal NXDOMAIN responses. This was an important step as many domain owner intentionally setup their nameservers to ignore the reverse lookups needed to enrich flow data. In addition to this change, I submitted am enhancement which allows for concurrent queries when caching is enabled. The Logstash team approved this change, and it is included in 3.0.10 of the plugin.
With these changes I can finally give the green light for using DNS lookups to enrich the incoming data. You will see a little slow down in throughput until the cache warms up, but that usually lasts only a few minutes. Once the cache is warmed up, the overhead is minimal, and event rates averaging 10K/s and as high as 40K/s were observed in testing.
The key to good performance is setting up the cache appropriately. Most likely it will be DNS timeouts that are the source of most latency. So ensuring that a higher volume of such misses can be cached for longer periods of time is most important.
The DNS lookup features of sýnesis™ Lite for Suricata can be configured using the following environment variables:
| Environment Variable | Description | Default Value |
|---|---|---|
| SYNLITE_SURICATA_RESOLVE_IP2HOST | Enable/Disable DNS requests | false |
| SYNLITE_SURICATA_NAMESERVER | The DNS server to which the dns filter should send requests | 127.0.0.1 |
| SYNLITE_SURICATA_DNS_HIT_CACHE_SIZE | The cache size for successful DNS queries | 25000 |
| SYNLITE_SURICATA_DNS_HIT_CACHE_TTL | The time in seconds successful DNS queries are cached | 900 |
| SYNLITE_SURICATA_DNS_FAILED_CACHE_SIZE | The cache size for failed DNS queries | 75000 |
| SYNLITE_SURICATA_DNS_FAILED_CACHE_TTL | The time in seconds failed DNS queries are cached | 3600 |
9. Start Logstash
You should now be able to start Logstash and begin collecting network flow data. Assuming you are running a recent version of RedHat/CentOS or Ubuntu, and using systemd, complete these steps:
- Run
systemctl daemon-reloadto ensure any changes to the environment variables are recognized. - Run
systemctl start logstash
NOTICE! Make sure that you have already setup the Logstash init files by running
LS_HOME/bin/system-install. If the init files have not been setup you will receive an error.
To follow along as Logstash starts you can tail its log by running:
tail -f /var/log/logstash/logstash-plain.log
Logstash takes a little time to start... BE PATIENT!
Logstash setup is now complete. If you are receiving data from Filebeat, you should have both suricata- and suricata_stats- daily indices in Elasticsearch.
Setting up Kibana
The vizualizations and dashboards can be loaded into Kibana by importing the synlite_suricata.kibana.7.1.x.json file from within the Kibana UI. This is done in the Kibana Management app under Saved Objects.
Recommended Kibana Advanced Settings
You may find that modifying a few of the Kibana advanced settings will produce a more user-friendly experience while using sýnesis™ Lite for Suricata . These settings are made in Kibana, under Management -> Advanced Settings.
| Advanced Setting | Value | Why make the change? |
|---|---|---|
| doc_table:highlight | false | There is a pretty big query performance penalty that comes with using the highlighting feature. As it isn't very useful for this use-case, it is better to just trun it off. |
| filters:pinnedByDefault | true | Pinning a filter will it allow it to persist when you are changing dashbaords. This is very useful when drill-down into something of interest and you want to change dashboards for a different perspective of the same data. This is the first setting I change whenever I am working with Kibana. |
| state:storeInSessionStorage | true | Kibana URLs can get pretty large. Especially when working with Vega visualizations. This will likely result in error messages for users of Internet Explorer. Using in-session storage will fix this issue for these users. |
| timepicker:quickRanges | see below | The default options in the Time Picker are less than optimal, for most logging and monitoring use-cases. Fortunately Kibana no allows you to customize the time picker. Our recommended settings can be found see below. |
Dashboards
The following dashboards are provided.
NOTE: The dashboards are optimized for a monitor resolution of 1920x1080.
Alerts - Overview
Alerts - Messages

Threats - Public Attackers

Threats - At-Risk Servers

Threats - At-Risk Services

Threats - High-Risk Clients

Flows - Overview

Flows - Top Talkers

Flows - Top Services

Flows - Sankey

Flows - Geo IP

Flows - Messages

HTTP - Overview

HTTP - Messages

DNS - Overview

DNS - Messages

SSH - Overview

SSH - Messages

TLS - Overview

TLS - Messages

SMB - Overview

SMB - Messages
NFS - Overview

NFS - Messages

Raw Logs

Statistics

Environment Variable Reference
The supported environment variables are:
| Environment Variable | Description | Default Value |
|---|---|---|
| SYNLITE_SURICATA_DICT_PATH | The path where the dictionary files are located | /etc/logstash/synlite_suricata/dictionaries |
| SYNLITE_SURICATA_TEMPLATE_PATH | The path to where index templates are located | /etc/logstash/synlite_suricata/templates |
| SYNLITE_SURICATA_GEOIP_DB_PATH | The path where the GeoIP DBs are located | /etc/logstash/synlite_suricata/geoipdbs |
| SYNLITE_SURICATA_GEOIP_CACHE_SIZE | The size of the GeoIP query cache | 8192 |
| SYNLITE_SURICATA_GEOIP_LOOKUP | Enable/Disable GeoIP lookups | true |
| SYNLITE_SURICATA_ASN_LOOKUP | Enable/Disable ASN lookups | true |
| SYNLITE_SURICATA_CLEANUP_SIGS | Enable this option to remove unneeded text from alert signatures. | false |
| SYNLITE_SURICATA_RESOLVE_IP2HOST | Enable/Disable DNS requests | false |
| SYNLITE_SURICATA_NAMESERVER | The DNS server to which the dns filter should send requests | 127.0.0.1 |
| SYNLITE_SURICATA_DNS_HIT_CACHE_SIZE | The cache size for successful DNS queries | 25000 |
| SYNLITE_SURICATA_DNS_HIT_CACHE_TTL | The time in seconds successful DNS queries are cached | 900 |
| SYNLITE_SURICATA_DNS_FAILED_CACHE_SIZE | The cache size for failed DNS queries | 75000 |
| SYNLITE_SURICATA_DNS_FAILED_CACHE_TTL | The time in seconds failed DNS queries are cached | 3600 |
| SYNLITE_SURICATA_ES_HOST | The Elasticsearch host to which the output will send data | 127.0.0.1:9200 |
| SYNLITE_SURICATA_ES_USER | The password for the connection to Elasticsearch | elastic |
| SYNLITE_SURICATA_ES_PASSWD | The username for the connection to Elasticsearch | changeme |
| SYNLITE_SURICATA_BEATS_HOST | The IP address on which to listen for Filebeat messages | 0.0.0.0 |
| SYNLITE_SURICATA_BEATS_PORT | The TCP port on which to listen for Filebeat messages | 5044 |
Recommended Setting for timepicker:quickRanges
I recommend configuring timepicker:quickRanges for the setting below. The result will look like this:

[
  {
    "from": "now-15m",
    "to": "now",
    "display": "Last 15 minutes"
  },
  {
    "from": "now-30m",
    "to": "now",
    "display": "Last 30 minutes"
  },
  {
    "from": "now-1h",
    "to": "now",
    "display": "Last 1 hour"
  },
  {
    "from": "now-2h",
    "to": "now",
    "display": "Last 2 hours"
  },
  {
    "from": "now-4h",
    "to": "now",
    "display": "Last 4 hours"
  },
  {
    "from": "now-12h",
    "to": "now",
    "display": "Last 12 hours"
  },
  {
    "from": "now-24h",
    "to": "now",
    "display": "Last 24 hours"
  },
  {
    "from": "now-48h",
    "to": "now",
    "display": "Last 48 hours"
  },
  {
    "from": "now-7d",
    "to": "now",
    "display": "Last 7 days"
  },
  {
    "from": "now-30d",
    "to": "now",
    "display": "Last 30 days"
  },
  {
    "from": "now-60d",
    "to": "now",
    "display": "Last 60 days"
  },
  {
    "from": "now-90d",
    "to": "now",
    "display": "Last 90 days"
  },
  {
    "from": "now/d",
    "to": "now/d",
    "display": "Today"
  },
  {
    "from": "now/w",
    "to": "now/w",
    "display": "This week"
  },
  {
    "from": "now/M",
    "to": "now/M",
    "display": "This month"
  },
  {
    "from": "now/d",
    "to": "now",
    "display": "Today so far"
  },
  {
    "from": "now/w",
    "to": "now",
    "display": "Week to date"
  },
  {
    "from": "now/M",
    "to": "now",
    "display": "Month to date"
  }
]
Attribution
This product includes GeoLite data created by MaxMind, available from (http://www.maxmind.com)