grafana / Carbon Relay Ng
Programming Languages
Projects that are alternatives of or similar to Carbon Relay Ng


carbon-relay-ng
A relay for carbon streams, in go. Like carbon-relay from the graphite project, except it:
- performs better: should be able to do about 100k ~ 1M million metrics per second depending on configuration and CPU speed.
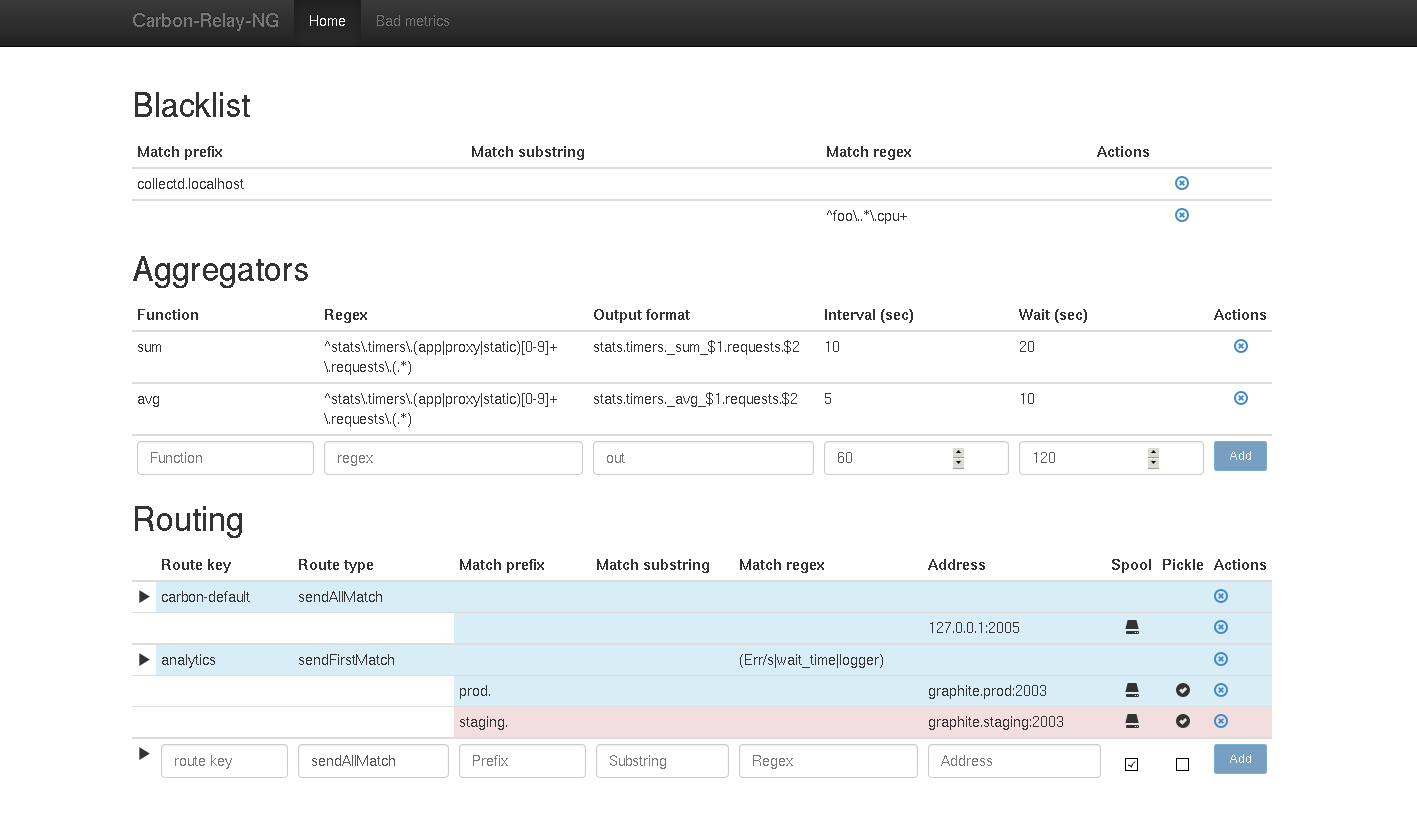
- you can adjust the routing table at runtime, in real time using the web or telnet interface (this feature has rough edges and is not production ready)
- has aggregator functionality built-in for cross-series, cross-time and cross-time-and-series aggregations.
- supports plaintext and pickle graphite routes (output) and metrics2.0/grafana.net, as well as kafka, Google PubSub and Amazon CloudWatch.
- graphite routes supports a per-route spooling policy. (i.e. in case of an endpoint outage, we can temporarily queue the data up to disk and resume later)
- performs validation on all incoming metrics (see below)
- supported inputs: plaintext, pickle and AMQP (rabbitmq)
This makes it easy to fanout to other tools that feed in on the metrics. Or balance/split load, or provide redundancy, or partition the data, etc. This pattern allows alerting and event processing systems to act on the data as it is received (which is much better than repeated reading from your storage)
Documentation
- configuration
- input
- validation
- rewriting
- aggregation
- monitoring
- TCP admin interface
- current changelog and official releasess
- limitations
- installation and building
- Deploying on Kubernetes
Concepts
You have 1 master routing table. This table contains 0-N routes. There's different route types. A carbon route can contain 0-M destinations (tcp endpoints)
First: "matching": you can match metrics on one or more of: prefix, substring, or regex. All 3 default to "" (empty string, i.e. allow all). The conditions are AND-ed. Regexes are more resource intensive and hence should - and often can be - avoided.
-
All incoming metrics are validated and go into the table when valid.
-
The table will then check metrics against the blacklist and discard when appropriate.
-
Then metrics pass through the rewriters and are modified if applicable. Rewrite rules wrapped with forward slashes are interpreted as regular expressions.
-
The table sends the metric to:
- the aggregators, who match the metrics against their rules, compute aggregations and feed results back into the table. see Aggregation section below for details.
- any routes that matches
-
The route can have different behaviors, based on its type:
- for grafanaNet / kafkaMdm / Google PubSub routes, there is only a single endpoint so that's where the data goes. For standard/carbon routes you can control how data gets routed into destinations (note that destinations have settings to match on prefix/sub/regex, just like routes):
- sendAllMatch: send all metrics to all the defined endpoints (possibly, and commonly only 1 endpoint).
- sendFirstMatch: send the metrics to the first endpoint that matches it.
- consistentHashing: the algorithm is the same as Carbon's consistent hashing.
- round robin: the route is a RR pool (not implemented)
carbon-relay-ng (for now) focuses on staying up and not consuming much resources.
For carbon routes:
- if connection is up but slow, we drop the data
- if connection is down and spooling enabled. we try to spool but if it's slow we drop the data
- if connection is down and spooling disabled -> drop the data
kafka, Google PubSub, and grafanaNet have an in-memory buffer and can be configured to blocking or non-blocking mode when the buffer runs full.