All Projects → vivek3141 → vector-field-visualizer

vivek3141 / vector-field-visualizer

Licence: MIT license
A python back-end web app to visualize a two dimensional vector field, and to calculate divergence and curl at any point.

Programming Languages

python
139335 projects - #7 most used programming language
HTML
75241 projects
javascript
184084 projects - #8 most used programming language
CSS
56736 projects
Makefile
30231 projects

Projects that are alternatives of or similar to vector-field-visualizer

11 Python Matplotlib Module
Matplotlib is an amazing visualization library in Python for 2D plots of arrays. Matplotlib is a multi-platform data visualization library built on NumPy arrays and designed to work with the broader SciPy stack. It was introduced by John Hunter in the year 2002. One of the greatest benefits of visualization is that it allows us visual access to …
Stars: ✭ 206 (+795.65%)
Mutual labels:  matplotlib
mplcairo
A (new) cairo backend for Matplotlib.
Stars: ✭ 87 (+278.26%)
Mutual labels:  matplotlib
qmplot
A Python package for creating high-quality manhattan and Q-Q plots from GWAS results.
Stars: ✭ 25 (+8.7%)
Mutual labels:  matplotlib
plot-likert
Python library to visualize results from Likert scale survey questions
Stars: ✭ 54 (+134.78%)
Mutual labels:  matplotlib
data-viz-utils
Functions for easily making publication-quality figures with matplotlib.
Stars: ✭ 16 (-30.43%)
Mutual labels:  matplotlib
FacebookChatStatistics
Statistics of any Facebook Messenger conversation
Stars: ✭ 49 (+113.04%)
Mutual labels:  matplotlib
chronist
Long-term analysis of emotion, age, and sentiment using Lifeslice and text records.
Stars: ✭ 23 (+0%)
Mutual labels:  matplotlib
Github-Stars-Predictor
It's a github repo star predictor that tries to predict the stars of any github repository having greater than 100 stars.
Stars: ✭ 34 (+47.83%)
Mutual labels:  matplotlib
QM-Simulator-1D
Interactive simulation of a quantum particle in 1D.
Stars: ✭ 69 (+200%)
Mutual labels:  matplotlib
psyplot
Python package for interactive data visualization
Stars: ✭ 64 (+178.26%)
Mutual labels:  matplotlib
EOmaps
A library to create interactive maps of geographical datasets
Stars: ✭ 193 (+739.13%)
Mutual labels:  matplotlib
abacus
📐 C# cross precision 3D maths library.
Stars: ✭ 35 (+52.17%)
Mutual labels:  vectors
ai for robotics
Visualizations of algorithms covered in Sebastian Thrun's excellent Artificial Intelligence for Robotics course on Udacity.
Stars: ✭ 125 (+443.48%)
Mutual labels:  matplotlib
skymapper
Mapping astronomical survey data on the sky, handsomely
Stars: ✭ 35 (+52.17%)
Mutual labels:  matplotlib
solr-vector-scoring
Vector Plugin for Solr: calculate dot product / cosine similarity on documents
Stars: ✭ 28 (+21.74%)
Mutual labels:  vectors
PyCoolPlot
A cool plotting module on Python
Stars: ✭ 30 (+30.43%)
Mutual labels:  matplotlib
tf-matplotlib
Seamlessly integrate matplotlib figures as tensorflow summaries.
Stars: ✭ 119 (+417.39%)
Mutual labels:  matplotlib
Data-Science-Articles
A collection of my blogs on Data Science and Machine learning.
Stars: ✭ 66 (+186.96%)
Mutual labels:  matplotlib
Crawler4Caida
一个致力于用Python提高部门工作自动化水平的程序库!(包括数据采集、办公自动化、辅助研究、图网络、复杂系统、3D可视化等)
Stars: ✭ 82 (+256.52%)
Mutual labels:  matplotlib
Machine-Learning-with-Iris-Dataset
Data Visualization and Machine Learning with Iris Dataset.
Stars: ✭ 65 (+182.61%)
Mutual labels:  matplotlib

Vector Field Visualizer

A python program to visualize a two dimensional vector field, and to calculate divergence and curl at any point.

Requirements

Install the requirements by

pip install -r requirements.txt

OR

  • matplotlib - pip install matplotlib

Usage

python3 main.py [fx] [fy] --mode [mode] --skip [skip] \
--bound [bound] --prop [prop]

--mode

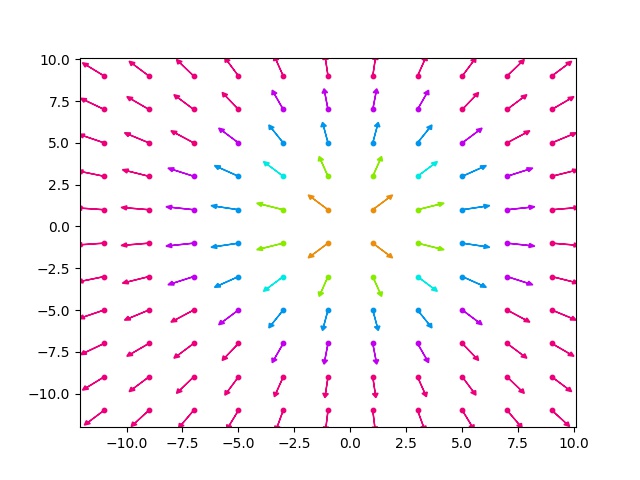
Set mode to COLOR to use color to portray length instead of actual length.

--prop

Use prop to adjust the length for which the color should change.

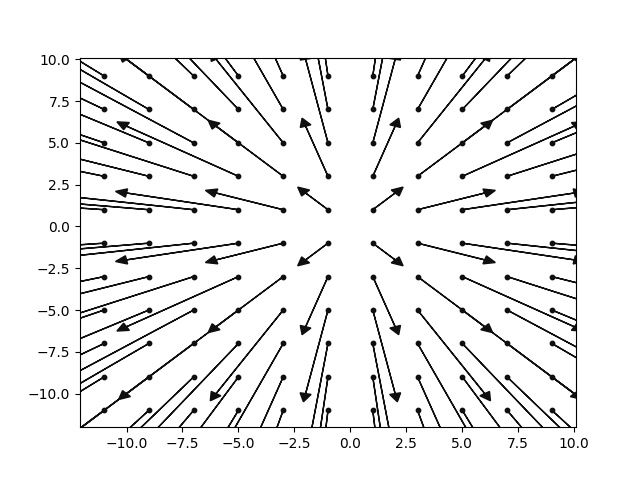
Set mode to BLACK to use actual length.

Examples

python3 main.py x y --mode "COLOR"


python3 main.py x y --mode "BLACK"

--skip

Skip is the space between each vector for X and Y. Eg. --skip 2

--bound

Set for bounds of X and Y. Eg. --boundx "-10,10"

Note that the project description data, including the texts, logos, images, and/or trademarks, for each open source project belongs to its rightful owner. If you wish to add or remove any projects, please contact us at [email protected].