All Projects → enix → X509 Certificate Exporter

enix / X509 Certificate Exporter

Licence: mit
A Prometheus exporter to monitor x509 certificates expiration in Kubernetes clusters or standalone

Programming Languages

go
31211 projects - #10 most used programming language

Projects that are alternatives of or similar to X509 Certificate Exporter

Kube Opex Analytics
🎨 Kubernetes Cost Allocation and Capacity Planning Analytics Tool. Hourly, daily, monthly reports - Prometheus exporter - Built-in & Grafana dashboard.
Stars: ✭ 232 (+480%)
Mutual labels:  prometheus-exporter, grafana-dashboard, dashboard
Unifi Poller
Application: Collect ALL UniFi Controller, Site, Device & Client Data - Export to InfluxDB or Prometheus
Stars: ✭ 1,050 (+2525%)
Mutual labels:  prometheus-exporter, grafana-dashboard, dashboard
kafka-consumer-lag-monitoring
Client tool that exports the consumer lag of Kafka consumer groups to Prometheus or your terminal
Stars: ✭ 45 (+12.5%)
Mutual labels:  prometheus-exporter, grafana-dashboard, monitoring-tool
elcep
Elastic Log Counter Exporter for Prometheus
Stars: ✭ 14 (-65%)
Mutual labels:  prometheus-exporter, monitoring-tool
Legend
Legend builds and publishes Grafana dashboards for your services with prefilled metrics and alerts for your services.
Stars: ✭ 149 (+272.5%)
Mutual labels:  monitoring-tool, grafana-dashboard
Grafana Dashboards
Grafana Dashboards
Stars: ✭ 228 (+470%)
Mutual labels:  grafana-dashboard, dashboard
Dark
(grafana) Dashboards As Resources in Kubernetes
Stars: ✭ 190 (+375%)
Mutual labels:  grafana-dashboard, dashboard
aerospike exporter
A prometheus exporter for collecting aerospike metrics
Stars: ✭ 13 (-67.5%)
Mutual labels:  prometheus-exporter, grafana-dashboard
unpoller
Application: Collect ALL UniFi Controller, Site, Device & Client Data - Export to InfluxDB or Prometheus
Stars: ✭ 1,613 (+3932.5%)
Mutual labels:  prometheus-exporter, grafana-dashboard
tado-exporter
A Prometheus exporter for tado smart heating solution
Stars: ✭ 32 (-20%)
Mutual labels:  prometheus-exporter, grafana-dashboard
dex
Prometheus Docker EXporter
Stars: ✭ 19 (-52.5%)
Mutual labels:  prometheus-exporter, grafana-dashboard
Ward
Server dashboard
Stars: ✭ 1,026 (+2465%)
Mutual labels:  monitoring-tool, dashboard
Pagerbeauty
📟✨ PagerDuty on-call widget for monitoring dashboard. Datadog and Grafana compatible
Stars: ✭ 250 (+525%)
Mutual labels:  grafana-dashboard, dashboard
spark-alarm
Alerting and monitoring tool for Apache Spark
Stars: ✭ 23 (-42.5%)
Mutual labels:  alert, monitoring-tool
couchbase-exporter
Prometheus Couchbase 5 Exporter, Grafana dashboard and Alerting rules included
Stars: ✭ 41 (+2.5%)
Mutual labels:  prometheus-exporter, grafana-dashboard
Pihole Exporter
A Prometheus exporter for PI-Hole's Raspberry PI ad blocker
Stars: ✭ 352 (+780%)
Mutual labels:  prometheus-exporter, grafana-dashboard
Chronograf
Open source monitoring and visualization UI for the TICK stack
Stars: ✭ 1,245 (+3012.5%)
Mutual labels:  alert, dashboard
gethexporter
Monitor your Geth Ethereum Server with Prometheus and Grafana
Stars: ✭ 103 (+157.5%)
Mutual labels:  prometheus-exporter, grafana-dashboard
Prometheus
A docker-compose stack for Prometheus monitoring
Stars: ✭ 3,383 (+8357.5%)
Mutual labels:  grafana-dashboard, alert
Unifiedmetrics
Fully-featured metrics collection agent for Minecraft servers. Supports Prometheus and InfluxDB. Dashboard included out-of-box.
Stars: ✭ 29 (-27.5%)
Mutual labels:  prometheus-exporter, grafana-dashboard

🔏 X.509 Certificate Exporter

Build status Code coverage Go Report License MIT Brought by Enix

A Prometheus exporter for certificates focusing on expiration monitoring, written in Go. Designed to monitor Kubernetes clusters from inside, it can also be used as a standalone exporter.

Get notified before they expire:

  • PEM encoded files, by path or scanning directories
  • Kubeconfigs with embedded certificates or file references
  • TLS Secrets from a Kubernetes cluster

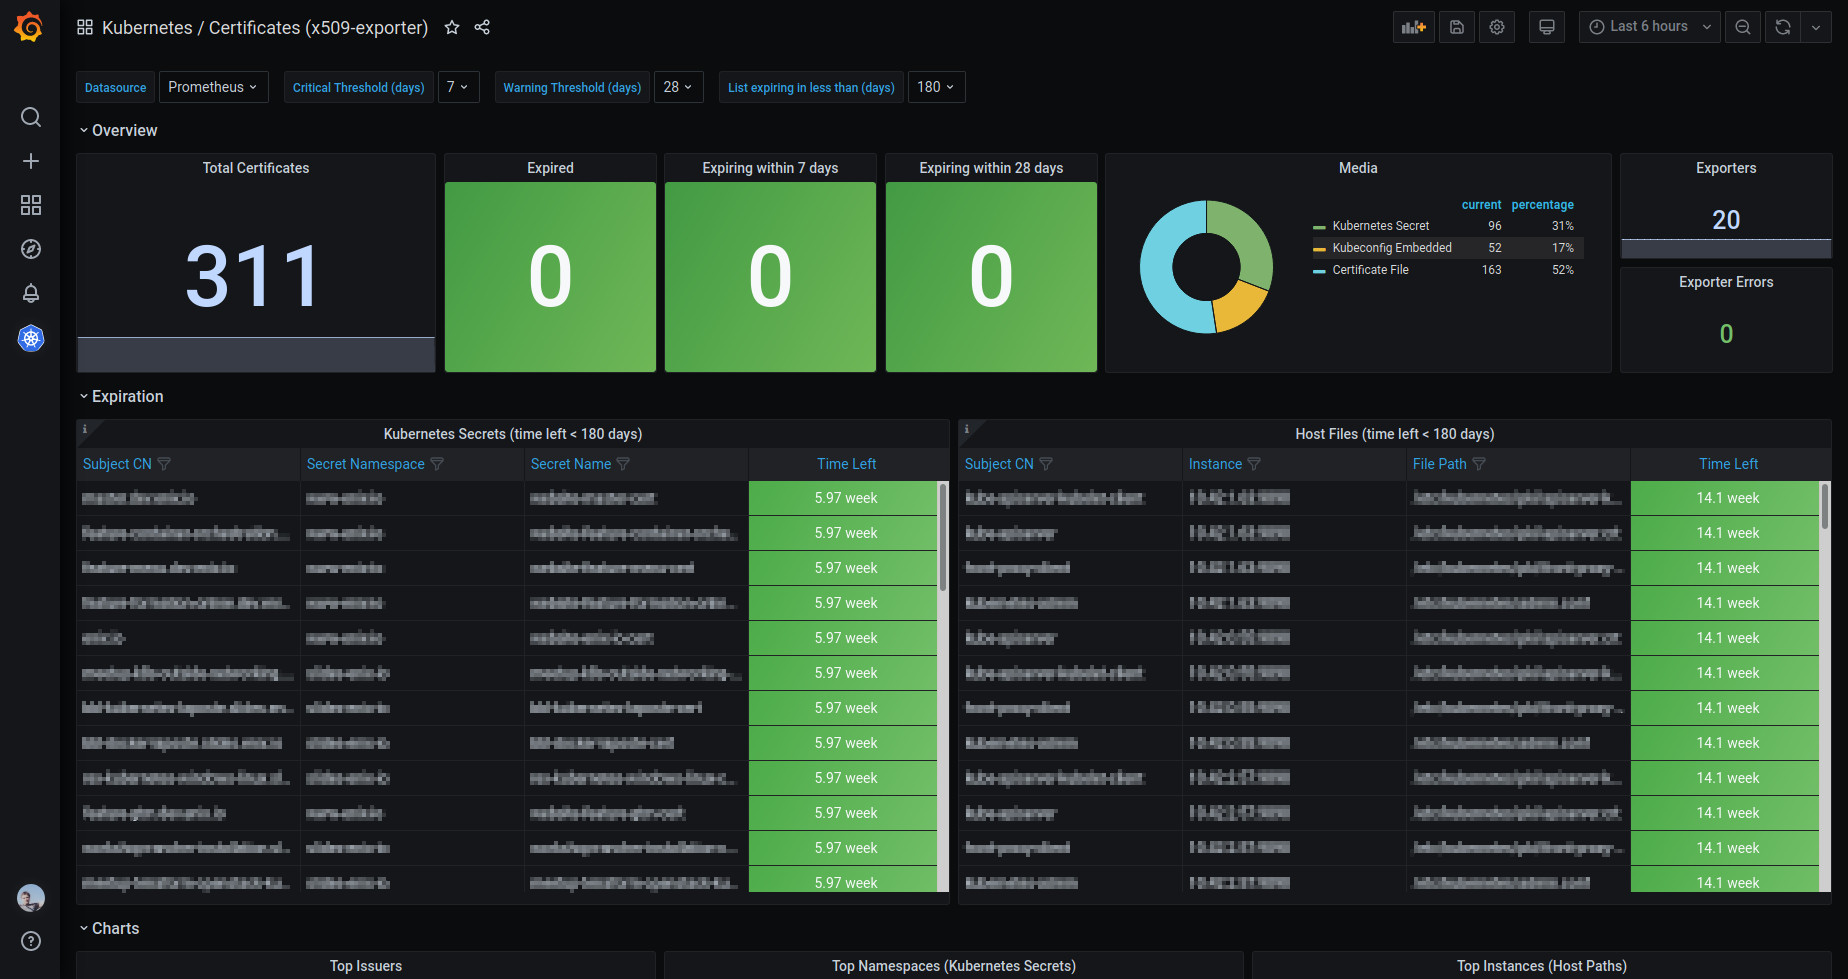
Grafana Dashboard

Installation

🏃 TL; DR

The Helm chart is the most straightforward way to get a fully-featured exporter running on your cluster. The chart is also highly-customizable if you wish to. See the chart documentation to learn more.

The provided Grafana Dashboard can also be used to display the exporter's metrics on your Grafana instance.

Using Docker

A docker image is available at enix/x509-certificate-exporter.

Using the pre-built binaries

Every release comes with pre-built binaries for many supported platforms.

Using the source

The project's entry point is ./cmd/x509-certificate-exporter. You can run & build it as any other Go program :

go build ./cmd/x509-certificate-exporter

Usage

The following metrics are available:

  • x509_cert_not_before
  • x509_cert_not_after
  • x509_cert_expired
  • x509_read_errors

Advanced usage

For advanced configuration, see the program's --help :

Usage: x509-certificate-exporter [-hv] [--debug] [-d value] [--exclude-label value] [--exclude-namespace value] [--expose-relative-metrics] [-f value] [--include-label value] [--include-namespace value] [-k value] [-p value] [-s value] [--trim-path-components value] [--watch-kube-secrets] [parameters ...]
     --debug       enable debug mode
 -d, --watch-dir=value
                   watch one or more directory which contains x509 certificate
                   files (not recursive)
     --exclude-label=value
                   removes the kube secrets with the given label (or label
                   value if specified) from the watch list (applied after
                   --include-label)
     --exclude-namespace=value
                   removes the given kube namespace from the watch list
                   (applied after --include-namespace)
     --expose-relative-metrics
                   expose additionnal metrics with relative durations instead
                   of absolute timestamps
 -f, --watch-file=value
                   watch one or more x509 certificate file
 -h, --help        show this help message and exit
     --include-label=value
                   add the kube secrets with the given label (or label value if
                   specified) to the watch list (when used, all secrets are
                   excluded by default)
     --include-namespace=value
                   add the given kube namespace to the watch list (when used,
                   all namespaces are excluded by default)
 -k, --watch-kubeconf=value
                   watch one or more Kubernetes client configuration (kind
                   Config) which contains embedded x509 certificates or PEM
                   file paths
 -p, --port=value  prometheus exporter listening port [9793]
 -s, --secret-type=value
                   one or more kubernetes secret type & key to watch (e.g.
                   "kubernetes.io/tls:tls.crt"
     --trim-path-components=value
                   remove <n> leading component(s) from path(s) in label(s)
 -v, --version     show version info and exit
     --watch-kube-secrets
                   scrape kubernetes.io/tls secrets and monitor them

FAQ

Why are you using the not after timestamp rather than a remaining number of seconds?

For two reasons.

First, Prometheus tends to do better storage consumption when a value stays identical over checks.

Then, it is better to compute the remaining time through a prometheus query as some latency (seconds) can exist between this exporter check and your alert or query being run.

Here is an exemple:

x509_cert_not_after - time()

When collecting metrics from tools like Datadog that does not have timestamp functions, the exporter can be run with the --expose-relative-metrics flag in order to add the following optional metrics:

  • x509_cert_valid_since_seconds
  • x509_cert_expires_in_seconds

How to ensure it keeps working over time?

Changes in paths or deleted files may silently break the ability to watch critical certificates.

Because it's never convenient to alert on disapearing metrics, the exporter will publish on x509_read_errors how many paths could not be read. It will also count Kubernetes API responses failures, but won't count deleted secrets.

A basic alert would be:

x509_read_errors > 0
Note that the project description data, including the texts, logos, images, and/or trademarks, for each open source project belongs to its rightful owner. If you wish to add or remove any projects, please contact us at [email protected].