All Projects → Jannchie → Anichart.js

Jannchie / Anichart.js

Licence: mit
Easily create data visualization animation videos

Programming Languages

typescript
32286 projects

Projects that are alternatives of or similar to Anichart.js

Reaviz
📊 Data visualization library for React based on D3
Stars: ✭ 215 (-55.21%)
Mutual labels:  data-visualization, d3
Canvas2video
Convert dynamic canvas to video, support merge audio
Stars: ✭ 117 (-75.62%)
Mutual labels:  ffmpeg, canvas
Plotly Graphing Library For Matlab
Plotly Graphing Library for MATLAB®
Stars: ✭ 234 (-51.25%)
Mutual labels:  data-visualization, d3
Visx
🐯 visx | visualization components
Stars: ✭ 14,544 (+2930%)
Mutual labels:  data-visualization, d3
Victory Chart
Chart Component for Victory
Stars: ✭ 286 (-40.42%)
Mutual labels:  data-visualization, d3
Plotly.js
Open-source JavaScript charting library behind Plotly and Dash
Stars: ✭ 14,268 (+2872.5%)
Mutual labels:  data-visualization, d3
React D3 Speedometer
✨ ⚛️ React Speedometer component using d3.js 🌈 🎨
Stars: ✭ 162 (-66.25%)
Mutual labels:  yarn, d3
Victory Native
victory components for react native
Stars: ✭ 2,013 (+319.38%)
Mutual labels:  data-visualization, d3
Floweaver
View flow data as Sankey diagrams
Stars: ✭ 266 (-44.58%)
Mutual labels:  data-visualization, d3
turkeyvisited
Mark the cities you have visited in Turkey and share the map!
Stars: ✭ 82 (-82.92%)
Mutual labels:  d3, canvas
Semiotic
A data visualization framework combining React & D3
Stars: ✭ 2,207 (+359.79%)
Mutual labels:  data-visualization, d3
Britecharts
Client-side reusable Charting Library based on D3.js v5 that allows easy and intuitive use of charts and components that can be composed together creating amazing visualizations.
Stars: ✭ 3,688 (+668.33%)
Mutual labels:  data-visualization, d3
Calendar Heatmap
A d3 heatmap for representing time series data similar to github's contribution chart
Stars: ✭ 1,985 (+313.54%)
Mutual labels:  data-visualization, d3
Keen Dataviz.js
Data Visualization Charting Library
Stars: ✭ 215 (-55.21%)
Mutual labels:  data-visualization, d3
Ngx Gauge
A highly customizable Gauge component for Angular 9+ apps and dashboards
Stars: ✭ 158 (-67.08%)
Mutual labels:  data-visualization, canvas
Clchart
A fast, simple and cross-platform(html5 react-native weex wechat-applet) stock chart library created using canvas.
Stars: ✭ 250 (-47.92%)
Mutual labels:  data-visualization, canvas
G2
📊 A highly interactive data-driven visualization grammar for statistical charts.
Stars: ✭ 11,020 (+2195.83%)
Mutual labels:  data-visualization, canvas
Electricitymap Contrib
A real-time visualisation of the CO2 emissions of electricity consumption
Stars: ✭ 2,138 (+345.42%)
Mutual labels:  data-visualization, d3
Ccapture.js
A library to capture canvas-based animations at a fixed framerate
Stars: ✭ 2,836 (+490.83%)
Mutual labels:  ffmpeg, canvas
Troika
A JavaScript framework for interactive 3D and 2D visualizations
Stars: ✭ 342 (-28.75%)
Mutual labels:  data-visualization, canvas


Code Time NPM npm GitHub last commit GitHub closed issues Language grade: JavaScript

中文文档

轻松地制作数据可视化动画视频。

示例

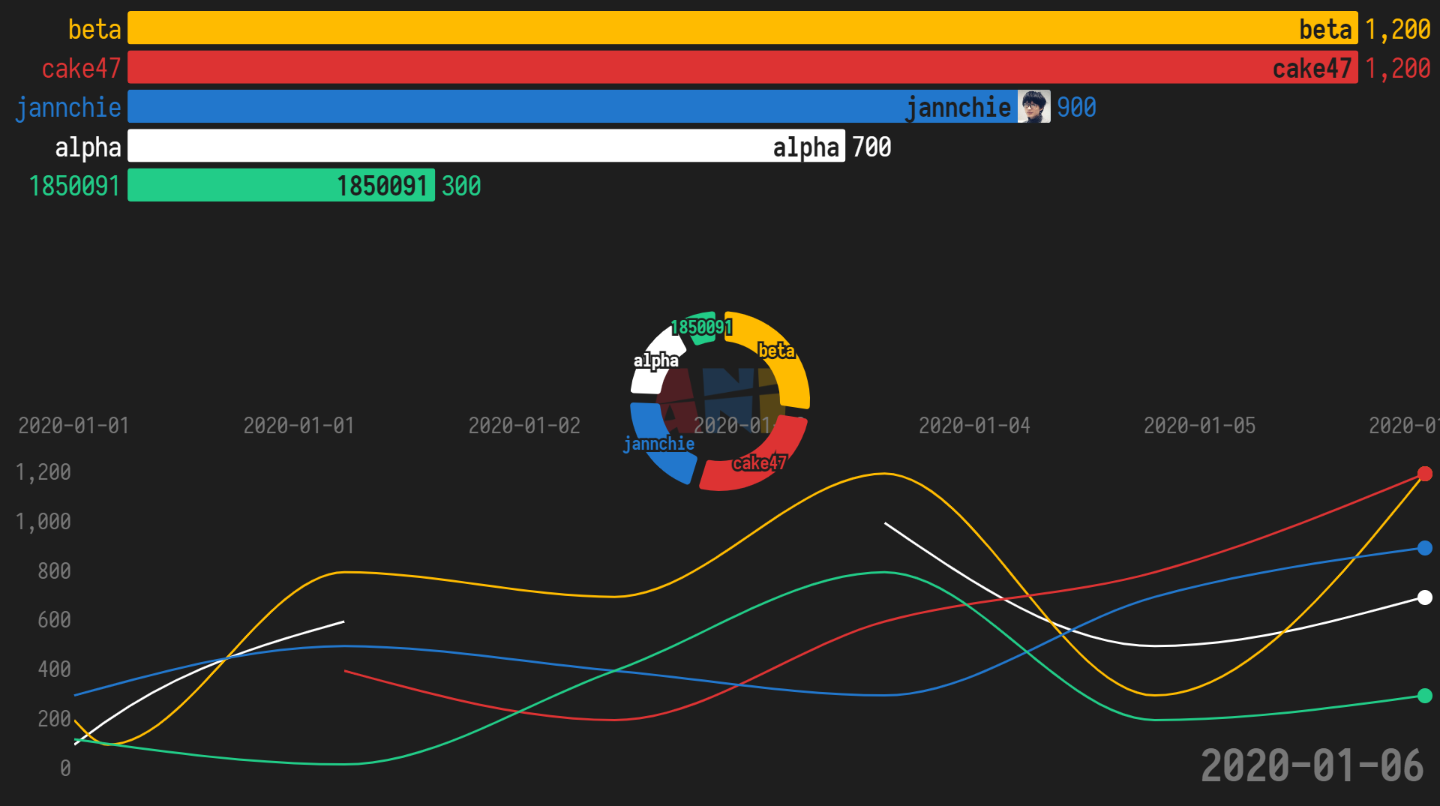
anichart-preview

在线编辑(v2.x)

Edit anichart 2.x

在线编辑(v1.x)

Edit e8em0

效果展示

点击前往示例项目

写在前面

开发过程中我认识到架构上的不合理之处,API正在重构中,仅有测试用例,没有项目文档。请谨慎使用。

本项目开源、自由、免费。

这是一个Web、Node等环境下,利用TypeScript或者JavaScript编程的动画库。可用于数据可视化、视频动画展示、片头片尾等领域。

目前正在开发中,虽然该有的功能已经实现了,但是没有提供友好的接口,想要做出自己的作品需要阅读源代码并了解JavaScript编程。

目前前端、后端导出视频均使用内置的FFmpeg。能够直接导出MP4。如果觉得wasm版本的FFmpeg速度过慢,也支持导出Png序列,调用本地FFmpeg生成视频。

人机交互友好的网站建设已经在搞了(指建好了仓库),还要较长一段时间才能完成。

本项目需要各位技术人员的技术支持。但如果你只是一个普通的使用者,也能通过赞助的方式支持。你可以通过爱赞助利用支付宝或者微信进行支持。也能通过GitHub Sponsor功能支持(需要信用卡一张)。

简介

这是一个更好的可视化模板。

相较于它的前身,主要优势在于:

  • 可编程化:开放接口,允许插入自定义的代码,利用框架计算的数据,基于Canvas Api进行绘图。
  • 直出视频:可以直接通过每一帧的图像渲染视频,无需借助任何录屏工具。保持了FPS的稳定和渲染的速度。并且归功于此,现在能够导出任何分辨率而不依赖于显示的屏幕范围。同时能够通过内置的API实现进度的拖动,便于调试。
  • 约定优于配置:最大程度简化了用户的配置,无需太多复杂的设定便可以获得美观的图表。
  • 虚拟组件:类似于虚拟DOM,通过拆分组件和渲染器,进一步增强了扩展能力。便于移植到更多的平台,以后会支持使用效率更高的webgl进行渲染。

安装

使用Yarn

yarn add anichart

使用Npm

npm i anichart

标签导入

<script src="https://cdn.jsdelivr.net/npm/[email protected]/dist/anichart.min.js"></script>

用法

即将过时:以下用法为1.x版本的API,2.x版本正在开发中,暂无API文档,但可以通过test文件夹的测试用例浏览用法。

使用Npm或者Yarn导入

如果使用标签导入可以跳过这一步,如果使用npm或者Yarn需要通过以下代码引入包:

const anichart = require("anichart");

或者

import * as anichart from "anichart";

准备数据

以CSV文件为例。

name,date,value,channel,other
Jannchie,2020-01-01,1,科技,other
Jannchie,2020-01-03,6,科技,other
Jannchie,2020-01-05,3,科技,other
Jannchie,2020-01-07,-,科技,other
Jannchie,2020-01-09,7,科技,other
Jannchie,2020-01-12,12,科技,other
Cake47,2020-01-03,10,生活,other
Cake47,2020-01-02,5,生活,other
Cake47,2020-01-06,2,生活,other
Cake47,2020-01-09,3,生活,other
Cake47,2020-01-11,4,生活,other

载入数据

// 默认情况下,需要通过内置的recourse对象载入数据
// 第一个参数是数据的路径,第二个参数是数据的名称
anichart.recourse.loadData("path/to/data.csv", "data")

创建对象

// 创建一个舞台
let stage = new anichart.Stage();
// 创建一个图表,默认情况下会载入名称为data的数据
let chart = new anichart.BarChart();
// 挂载图表
stage.addChild(chart);

播放动画

可以使用代码控制播放。

stage.play();

导出视频

内置了ffmpeg进行导出。输出信息会在console中打印。

// 配置导出视频
stage.output = true;

测试

Browser环境

使用yarn:

yarn serve

或者npn:

npm run serve

Node.js环境

不建议使用:Node.js 的版本在未来被暂时移除。因为相关依赖的包安装速度过于缓慢,使用体验较差。同时Browser版本的导出速度得到了极大的提升,这使得node版本显得不是特别重要了。之后Node.js版本将来会作为独立的版本进行安装。

如果有特殊需求,比如服务器端定时导出视频的用户,请等待正式版本。

node --experimental-wasm-threads --experimental-wasm-bulk-memory index.js
Note that the project description data, including the texts, logos, images, and/or trademarks, for each open source project belongs to its rightful owner. If you wish to add or remove any projects, please contact us at [email protected].