marmelab / Architecturetree
Programming Languages
Projects that are alternatives of or similar to Architecturetree
|
Archived Repository This code is no longer maintained. Feel free to fork it, but use it at your own risks. |
Marmelab ArchitectureTree
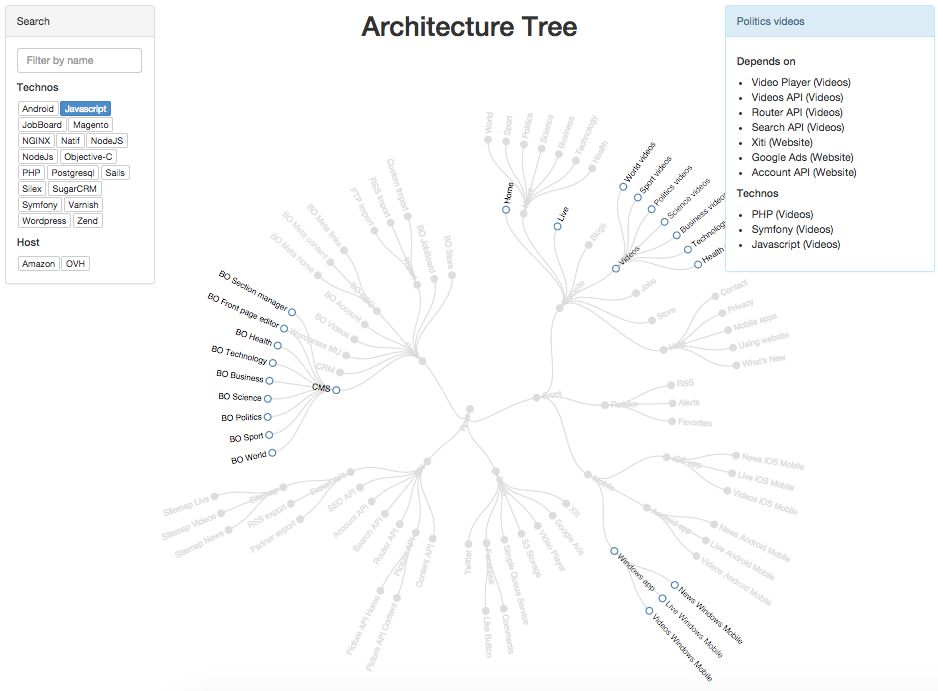
ArchitectureTree is a single page application to visualize and edit architecture schemas in the browser, built with d3.js and AngularJS.
Check out the online demo.
Motivation
We generally use a client software to draw our system architecture schema, like Microsoft Visio © for example. But often, only one member of the team has this software installed on their laptop. Besides, the schema often uses a specific file format, and there is no standard way to draw the schema. It quickly becomes very hard to maintain the schema as the software evolves.
ArchitectureTree give you the possibility to visualize and edit an architecture schema in your browser, and to save it as a JSON file.
Installation
Get The Code
git clone [email protected]:marmelab/ArchitectureTree.git
cd ArchitectureTree
Create Architecture File
Create a JSON description of your system, and save it as data.json. A good starting point is the provided data.json-dist example file:
cp data.json-dist data.json
Start Static Webserver
ArchitectureTree is entirely client-side. However, as it uses AJAX to load the architecture file, you'll need a static web server to use it from localhost.
For example, by using the PHP one:
php -S localhost:4000
Or the Python one:
python -m SimpleHTTPServer 4000
Then, navigate to http://localhost:4000/.
Tip: If you commit the code to the gh-pages branch of a GitHub repository, it'll be available for viewing.
Usage
Filters on name, technos and hosts are avalaible on the left hand side of the screen.
Details about a node reveal on the right hand side of the screen when hovering a node.
You can edit the node by clicking on it: the details box turns into a form. After you save your modifications, the JSON in the bottom textarea is automaticaly updated. Note that you can also edit the JSON directly in the textarea.
Since there is no server-side, you have to manualy report the json modifications into the data.json file, and commit it.
Data description file
The data.json file describes your architecture in a json format.
It allows versionning by using git or another SCM. It can be edited by anyone with access to the repository.
After any update to the description file, check that it works locally before committing (any JSON validation error will result in a blank screen). All charts rely on this data file.
Format
Each element of your system is defined by a JSON node entry. Here is an example:
{
    "name": "News",
    "children": [
        { "name": "World" },
        { "name": "Sport" }
    ],
    "url": "www.my-media-website.com/*",
    "dependsOn": ["Content API", "Xiti", "Search API", "OAS", "Account API", "    Picture API", "Router API"],
    "technos": ["PHP", "Javascript", "Silex", "NGINX", "Varnish"],
    "satisfaction": 0.9,
    "host": { "Amazon": ["fo-1", "fo-2"] }
}
Properties
-
name: name of the application / service / container -
children: list of sub-applications. -
url: where the application is available (if any) -
dependsOn: list of application dependencies. The mapping is done on the nodename(that means that two nodes cannot have the same name) -
technos: list of technologies used by the application -
satisfaction: Overall quality of the application; it's a number between1and0-
1for a good application -
0.8for application which need some refactoring -
0.2for a bad or not finished application -
0for an horrible one or not yet started
-
-
host: list of hosts where the application is hosted, grouped by name, with the list of corresponding server names or?if unknow (eg.:{ "Amazon": ["front-1", "front-2"] },"OVH": ["?"])
License
ArchitectureTree is licensed under the MIT Licence, courtesy of marmelab and Arte GEIE.
If you like ArchitectureTree and use it for an open-source project, please send us a screenshot of your ArchitectureTree at @marmelab!
And don't forget to check out our other visualizations: