jamiealquiza / Es Stats
ElasticSearch cluster metrics -> Graphite
Stars: ✭ 91
Programming Languages
go
31211 projects - #10 most used programming language
Projects that are alternatives of or similar to Es Stats
Hastic Server
Hastic data management server for analyzing patterns and anomalies from Grafana
Stars: ✭ 292 (+220.88%)
Mutual labels: elasticsearch, monitoring, metrics, graphite
Graylog Plugin Metrics Reporter
Graylog Metrics Reporter Plugins
Stars: ✭ 71 (-21.98%)
Mutual labels: elasticsearch, monitoring, metrics, graphite
Kenshin
Kenshin: A time-series database alternative to Graphite Whisper with 40x improvement in IOPS
Stars: ✭ 203 (+123.08%)
Mutual labels: monitoring, metrics, graphite
Grafana
The open and composable observability and data visualization platform. Visualize metrics, logs, and traces from multiple sources like Prometheus, Loki, Elasticsearch, InfluxDB, Postgres and many more.
Stars: ✭ 45,930 (+50372.53%)
Mutual labels: elasticsearch, monitoring, metrics
Influxgraph
Graphite InfluxDB backend. InfluxDB storage finder / plugin for Graphite API.
Stars: ✭ 87 (-4.4%)
Mutual labels: monitoring, metrics, graphite
Icinga2
Icinga is a monitoring system which checks
the availability of your network resources, notifies users of outages, and generates
performance data for reporting.
Stars: ✭ 1,670 (+1735.16%)
Mutual labels: monitoring, metrics, graphite
Appmetrics
App Metrics is an open-source and cross-platform .NET library used to record and report metrics within an application.
Stars: ✭ 1,986 (+2082.42%)
Mutual labels: monitoring, metrics, graphite
Graphite exporter
Server that accepts metrics via the Graphite protocol and exports them as Prometheus metrics
Stars: ✭ 217 (+138.46%)
Mutual labels: monitoring, metrics, graphite
Metrictank
metrics2.0 based, multi-tenant timeseries store for Graphite and friends.
Stars: ✭ 574 (+530.77%)
Mutual labels: monitoring, metrics, graphite
Graylog Plugin Metrics
Graylog output plugin for Graphite and Ganglia
Stars: ✭ 16 (-82.42%)
Mutual labels: monitoring, metrics, graphite
Homer App
HOMER 7.x Front-End and API Server
Stars: ✭ 88 (-3.3%)
Mutual labels: elasticsearch, monitoring, metrics
Vsphere2metrics
VMware vSphere Performance Metrics Integration with Graphite & InfluxDB
Stars: ✭ 28 (-69.23%)
Mutual labels: monitoring, metrics, graphite
Polymur
A fast carbon-relay with live routing controls + https Graphite forwarder
Stars: ✭ 97 (+6.59%)
Mutual labels: monitoring, metrics, graphite
Icingaweb2 Module Grafana
Grafana module for Icinga Web 2 (supports InfluxDB & Graphite)
Stars: ✭ 190 (+108.79%)
Mutual labels: monitoring, metrics, graphite
Carbon Relay Ng
Fast carbon relay+aggregator with admin interfaces for making changes online - production ready
Stars: ✭ 429 (+371.43%)
Mutual labels: monitoring, metrics, graphite
Logmonitor
Monitoring log files on windows systems.
Stars: ✭ 23 (-74.73%)
Mutual labels: monitoring, metrics, graphite
Tessera
A dashboard front-end for graphite.
Stars: ✭ 1,202 (+1220.88%)
Mutual labels: monitoring, metrics, graphite
Infra Integrations Sdk
New Relic Infrastructure Integrations SDK
Stars: ✭ 42 (-53.85%)
Mutual labels: monitoring, metrics
Statsviz
🚀 Instant live visualization of your Go application runtime statistics (GC, MemStats, etc.) in the browser
Stars: ✭ 1,015 (+1015.38%)
Mutual labels: monitoring, metrics
Graphyte
Python 3 compatible library to send data to a Graphite metrics server (Carbon)
Stars: ✭ 59 (-35.16%)
Mutual labels: metrics, graphite
es-stats
Reads key cluster metrics from ElasticSearch and writes to Graphite. Make pretty graphs:
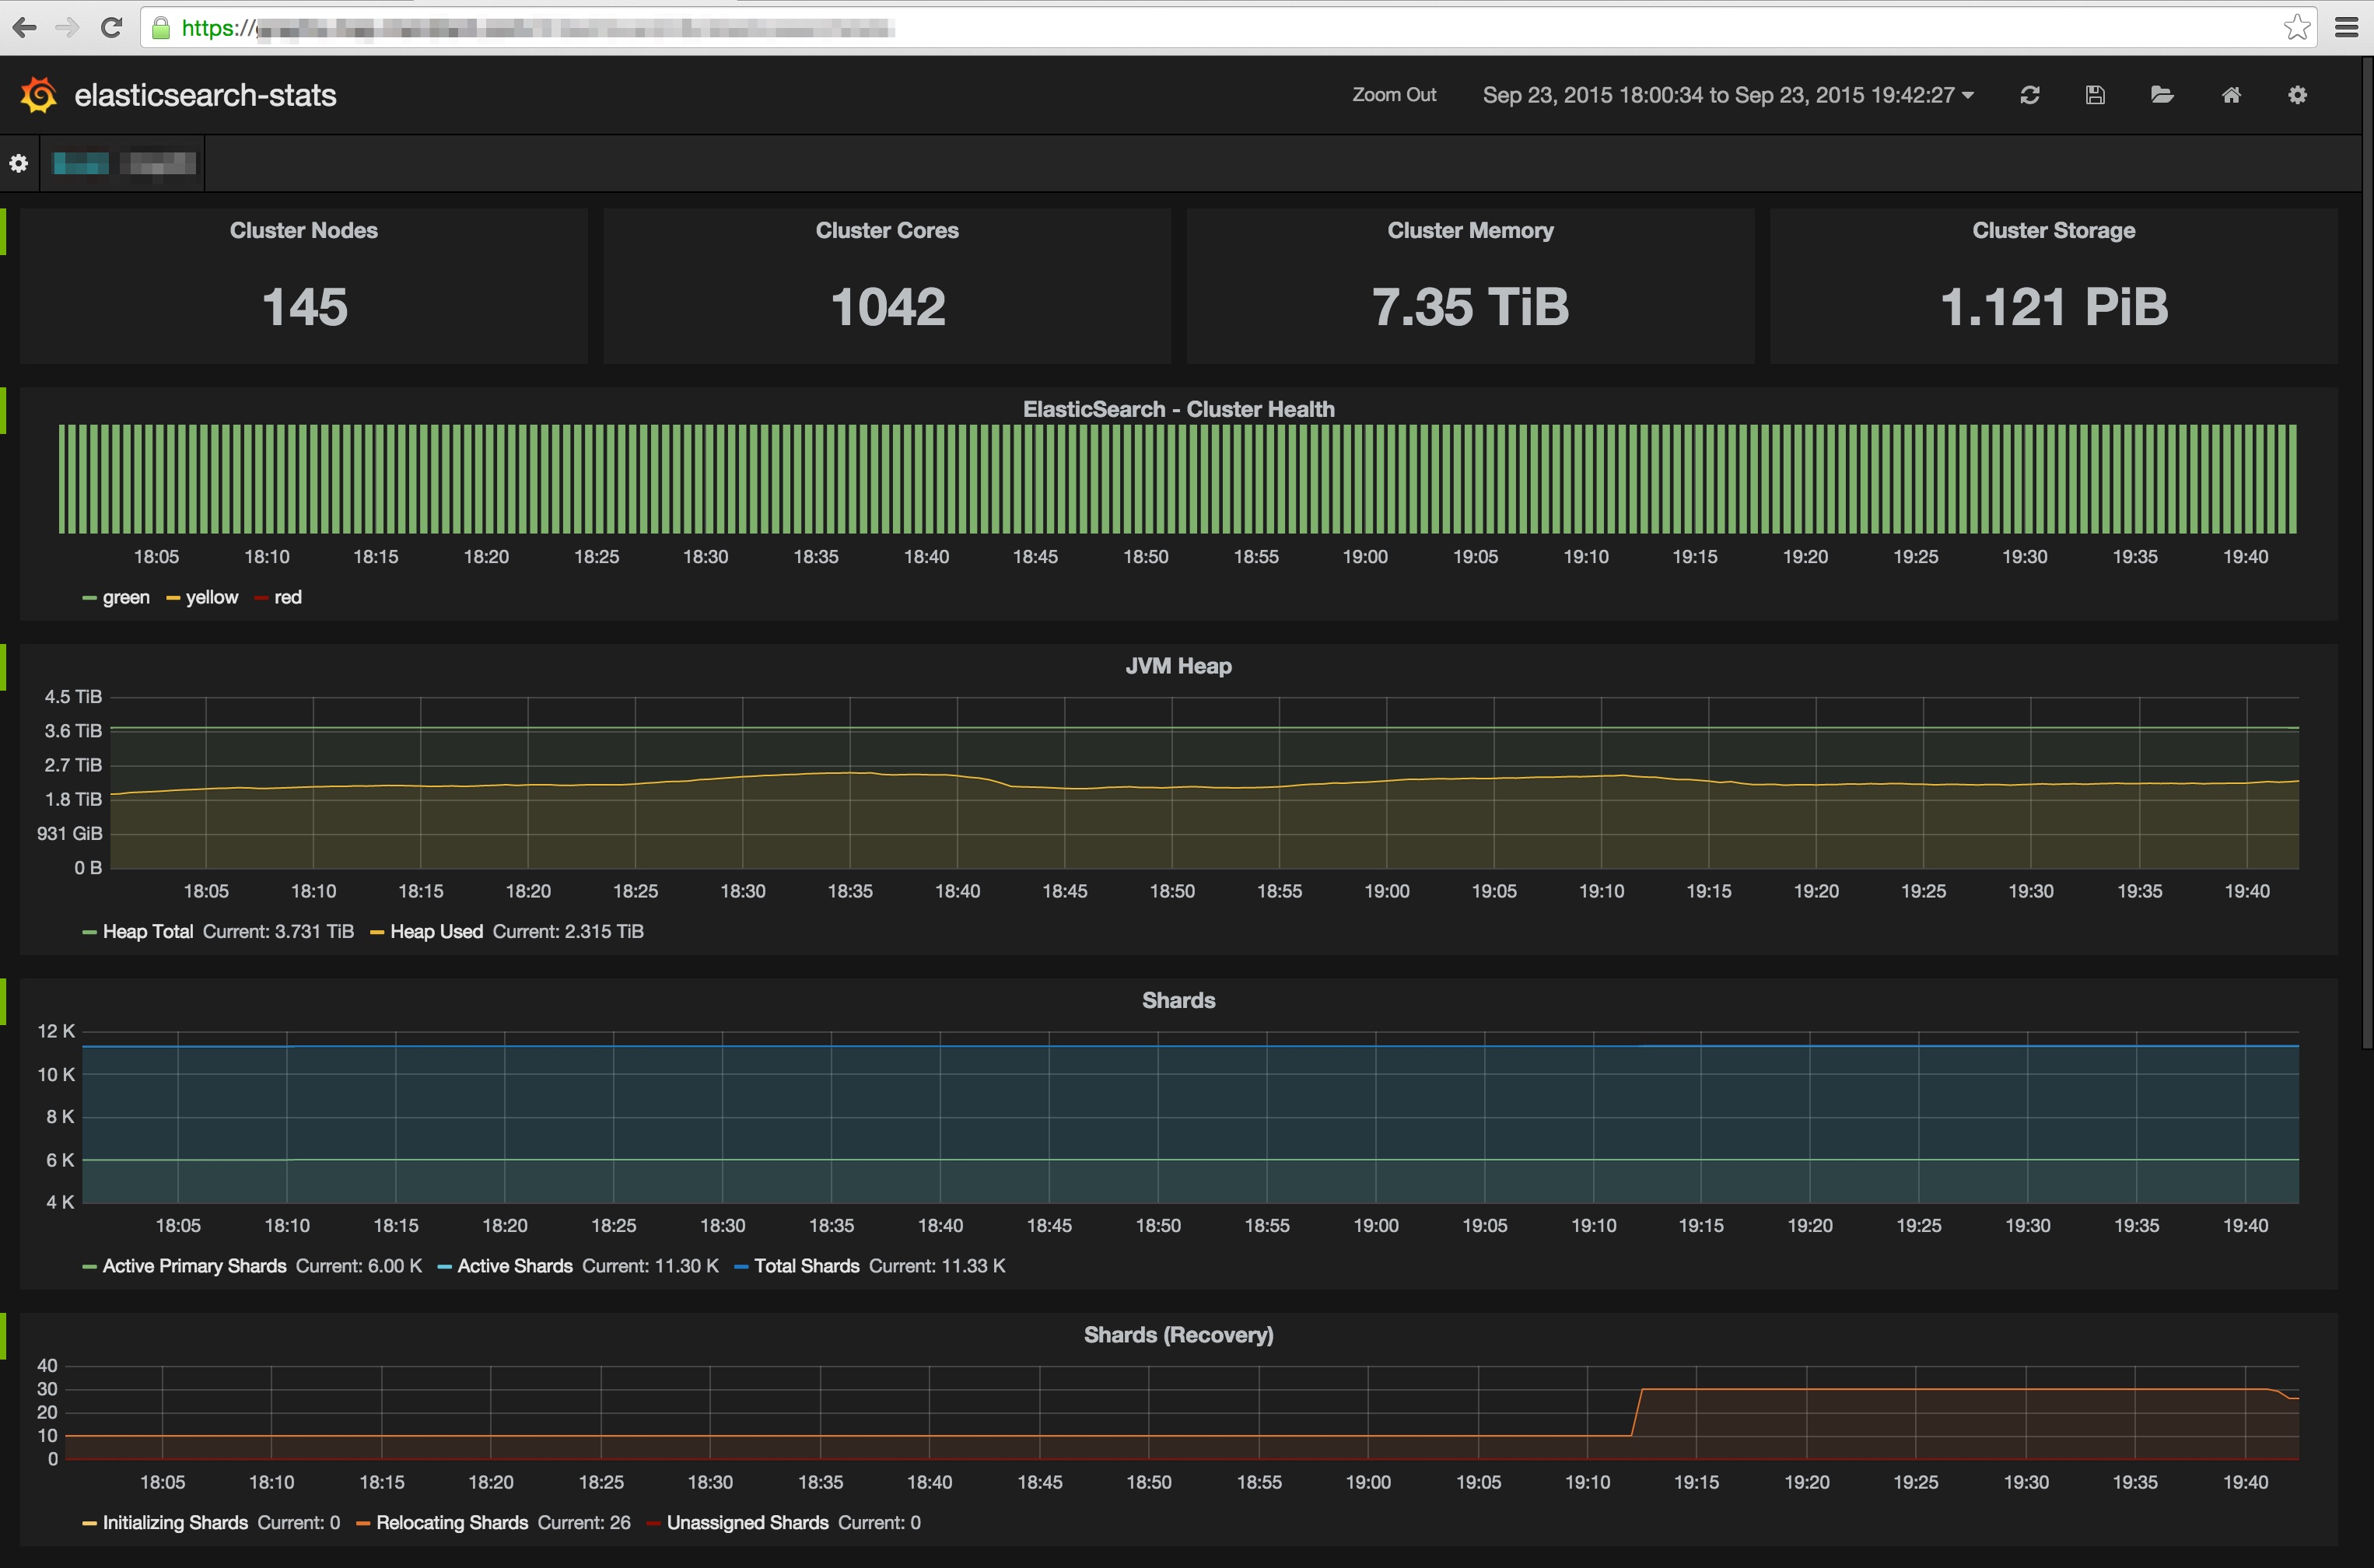
This is intended for high-level, general cluster data. More granular data is better fetched on a per-node basis using other tools.
Installation
es-stats has no external dependencies (you're welcome). Assuming Go is installed (built/tested with 1.4.x):
go get github.com/jamiealquiza/es-statsgo build github.com/jamiealquiza/es-stats
Binary will be found at: $GOPATH/bin/es-stats
Starter Grafana template: https://gist.github.com/jamiealquiza/298575115337fdf03ca5
Usage
Flags:
./es-stats -h
Usage of ./es-stats:
  -graphite-ip="": Destination Graphite IP address
  -graphite-port="2003": Destination Graphite plaintext port
  -interval=30: Metrics polling interval
  -ip="127.0.0.1": ElasticSearch IP address
  -metrics-prefix="elasticsearch": Top-level Graphite namespace prefix (defaults to hostname)
  -port="9200": ElasticSearch port
  -require-master=false: Only poll if node is an elected master
Running:
% ./es-stats -ip="192.168.100.204" -interval=5 -graphite-ip="192.168.100.175" -graphite-port="2013"
2015/03/04 15:27:56 Connected to ElasticSearch: http://192.168.100.204:9200
2015/03/04 15:27:56 Connected to Graphite: 192.168.100.175 port 2013
2015/03/04 15:28:01 Metrics received
2015/03/04 15:28:01 Metrics flushed to Graphite
2015/03/04 15:28:06 Metrics received
2015/03/04 15:28:06 Metrics flushed to Graphite
2015/03/04 15:28:11 Metrics received
2015/03/04 15:28:11 Metrics flushed to Graphite
2015/03/04 15:28:16 Metrics received
2015/03/04 15:28:16 Metrics flushed to Graphite
Get metrics:

Note that the project description data, including the texts, logos, images, and/or trademarks,
for each open source project belongs to its rightful owner.
If you wish to add or remove any projects, please contact us at [email protected].