jamiealquiza / Polymur
Programming Languages
Projects that are alternatives of or similar to Polymur
polymur
See Polymur-proxy and Polymur-gateway services for offsite metrics forwarding over HTTPS.
Helper blog post: Building Polymur: a tool for global Graphite-compatible metrics ingestion.
Found on Tools That Work With Graphite.
Feel free to open support requests as an issue labeled 'help wanted' or 'question' (checking closed issues with these labels may be helpful as well).
Overview
Polymur is a service that accepts Graphite plaintext protocol metrics (LF delimited messages) from tools like Collectd or Statsd, and either mirrors (broadcast) or hash routes* the output to one or more destinations - including more Polymur instances, native Graphite carbon-cache instances, and other Graphite protocol compatible services (such as InfluxDB). Polymur is efficient at terminating many thousands of connections and provides in-line buffering, per-destination flow control, runtime destination manipulation ("Let's mirror all our production metrics to x.x.x.x"), and failover redistribution (in hash-routing mode: if node C fails, redistribute in-flight metrics for this destination to nodes A and B).
Polymur was created to introduce more flexibility into the way metrics streams are managed and to reduce the total number of components needed to operate Graphite deployments. It's built in a natively concurrent fashion and doesn't require multiple instances per-node with a local load-balancer if it's being used as a Carbon relay upstream from your Graphite servers. If it's being used as a Carbon relay on your Graphite server to distribute metrics to Carbon-cache daemons, daemons can self register themselves on start using Polymur's simple API.
*Polymur's hash-route algo implementation mirrors the Graphite implementation; this is important since the Graphite project's web-app uses the same hash-routing mechanism for cached metric lookups.
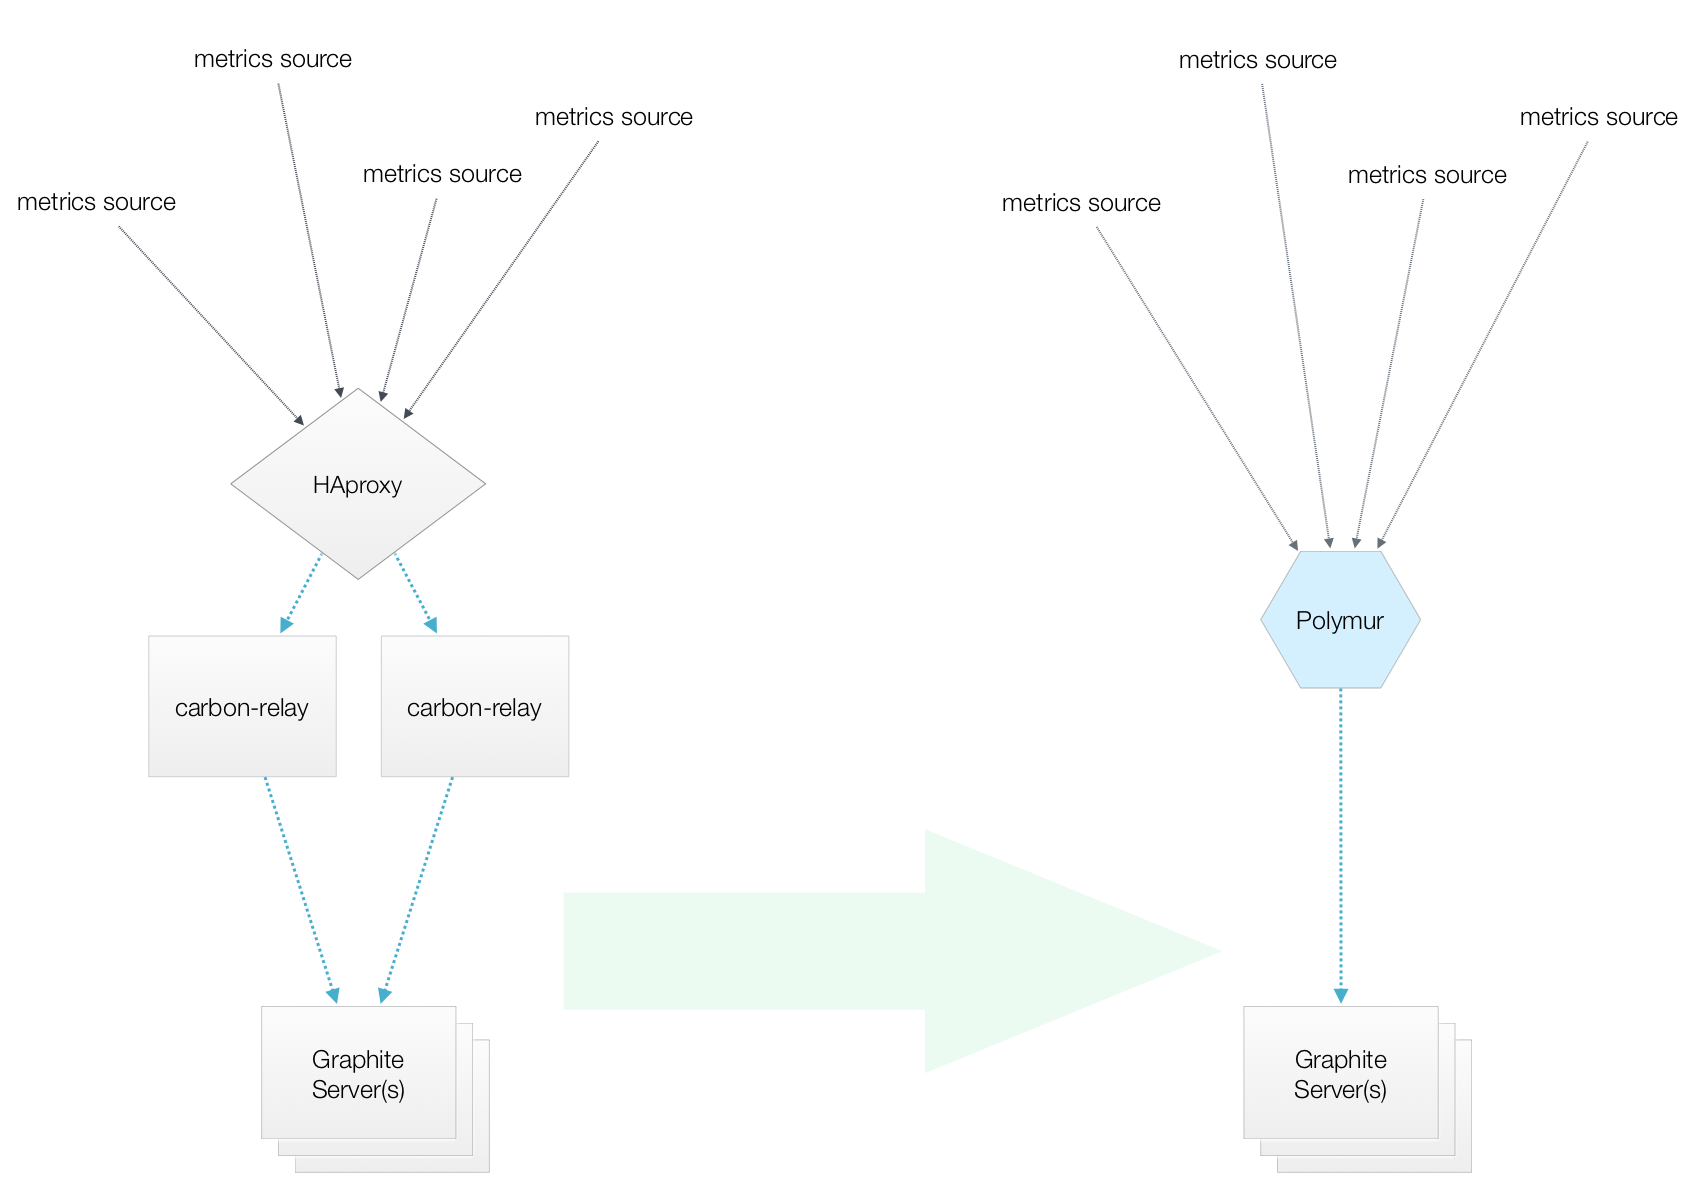
Polymur replacing upstream relays
Terminating connections from all sending hosts and distributing to downstream Graphite servers:
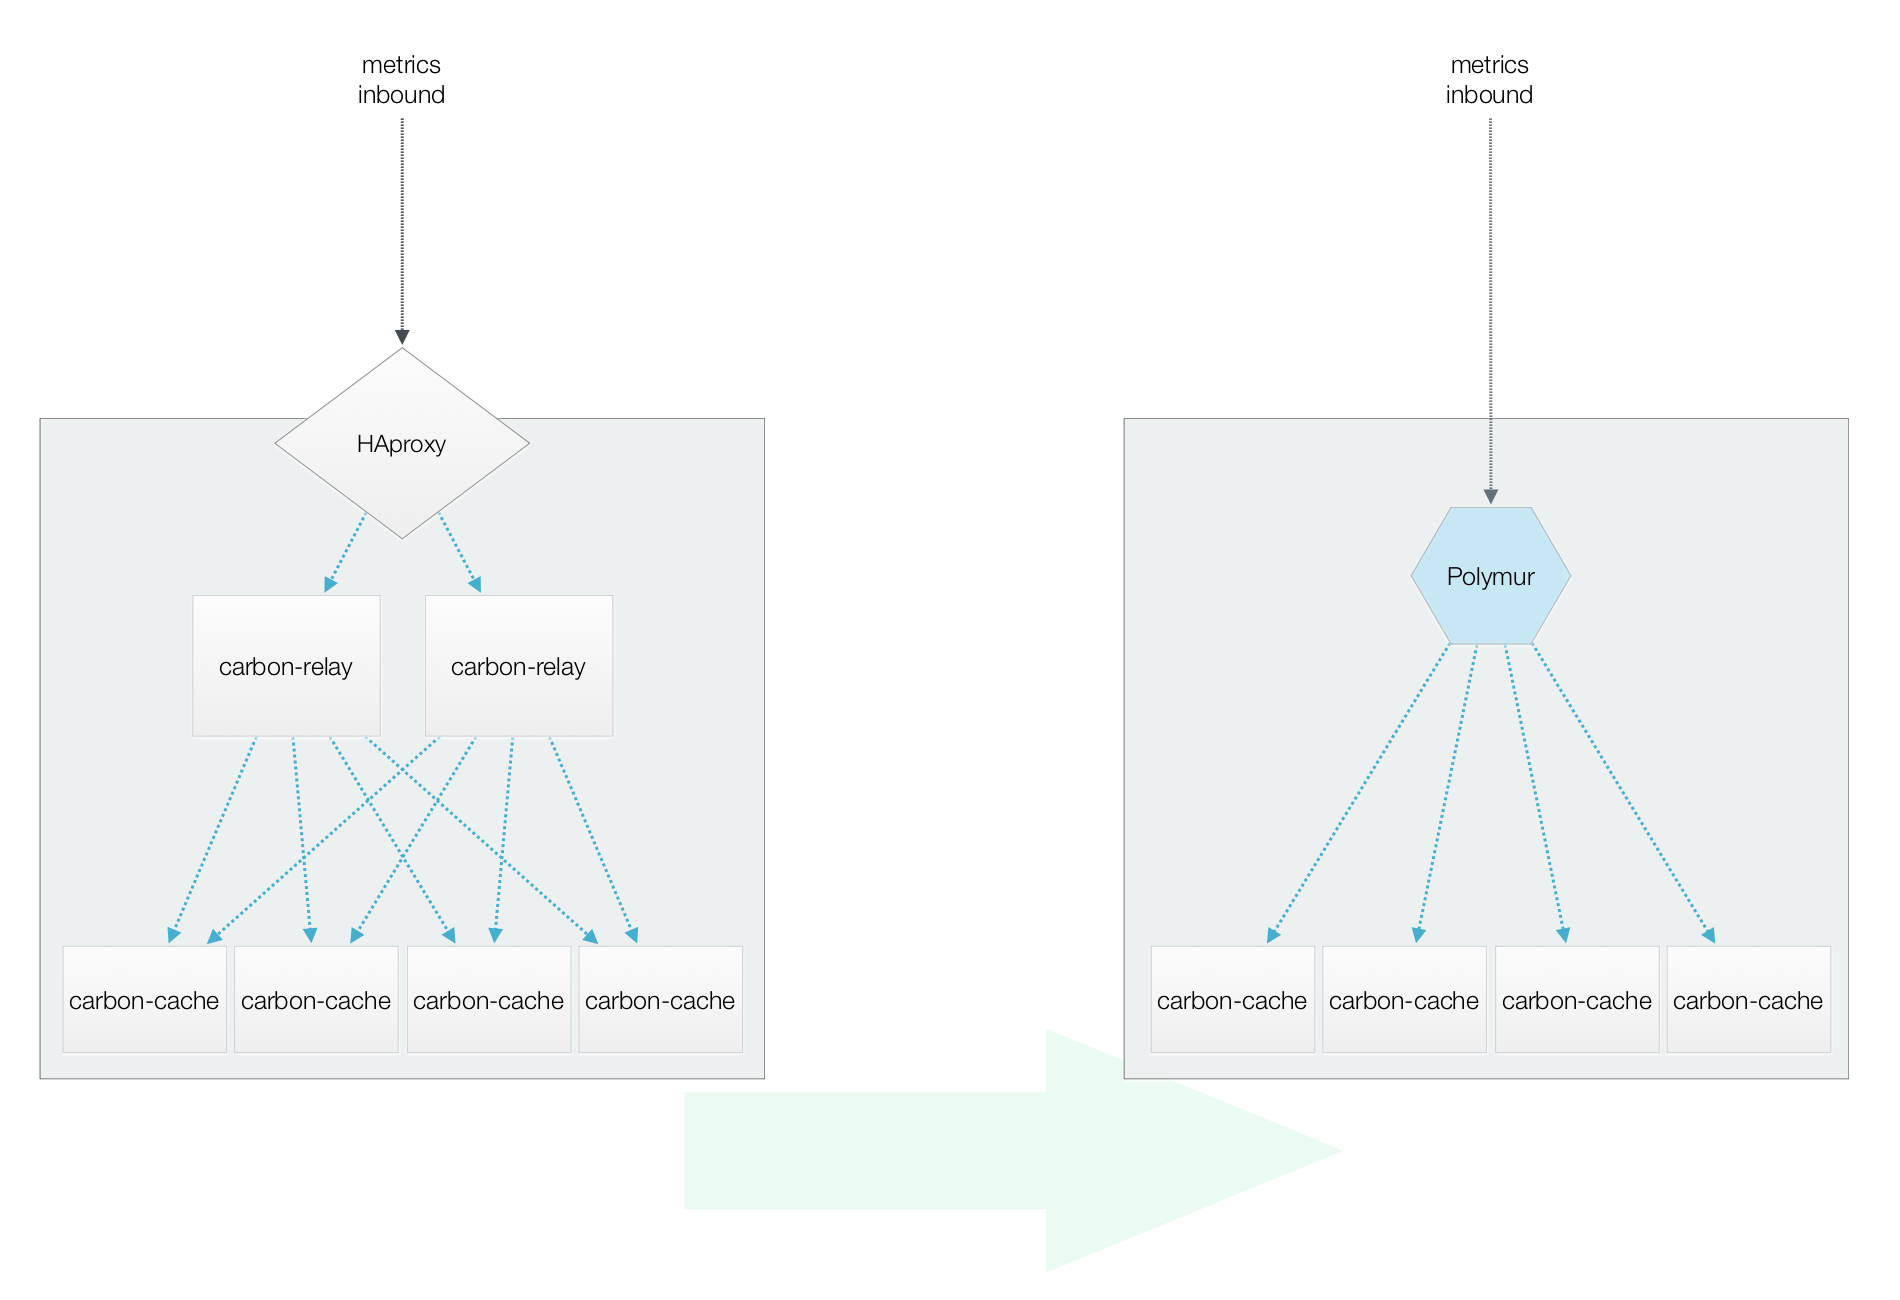
Polymur replacing local relays
Polymur running on a Graphite server in hash-routing mode, distributing metrics from upstream relays to local carbon-cache daemons:
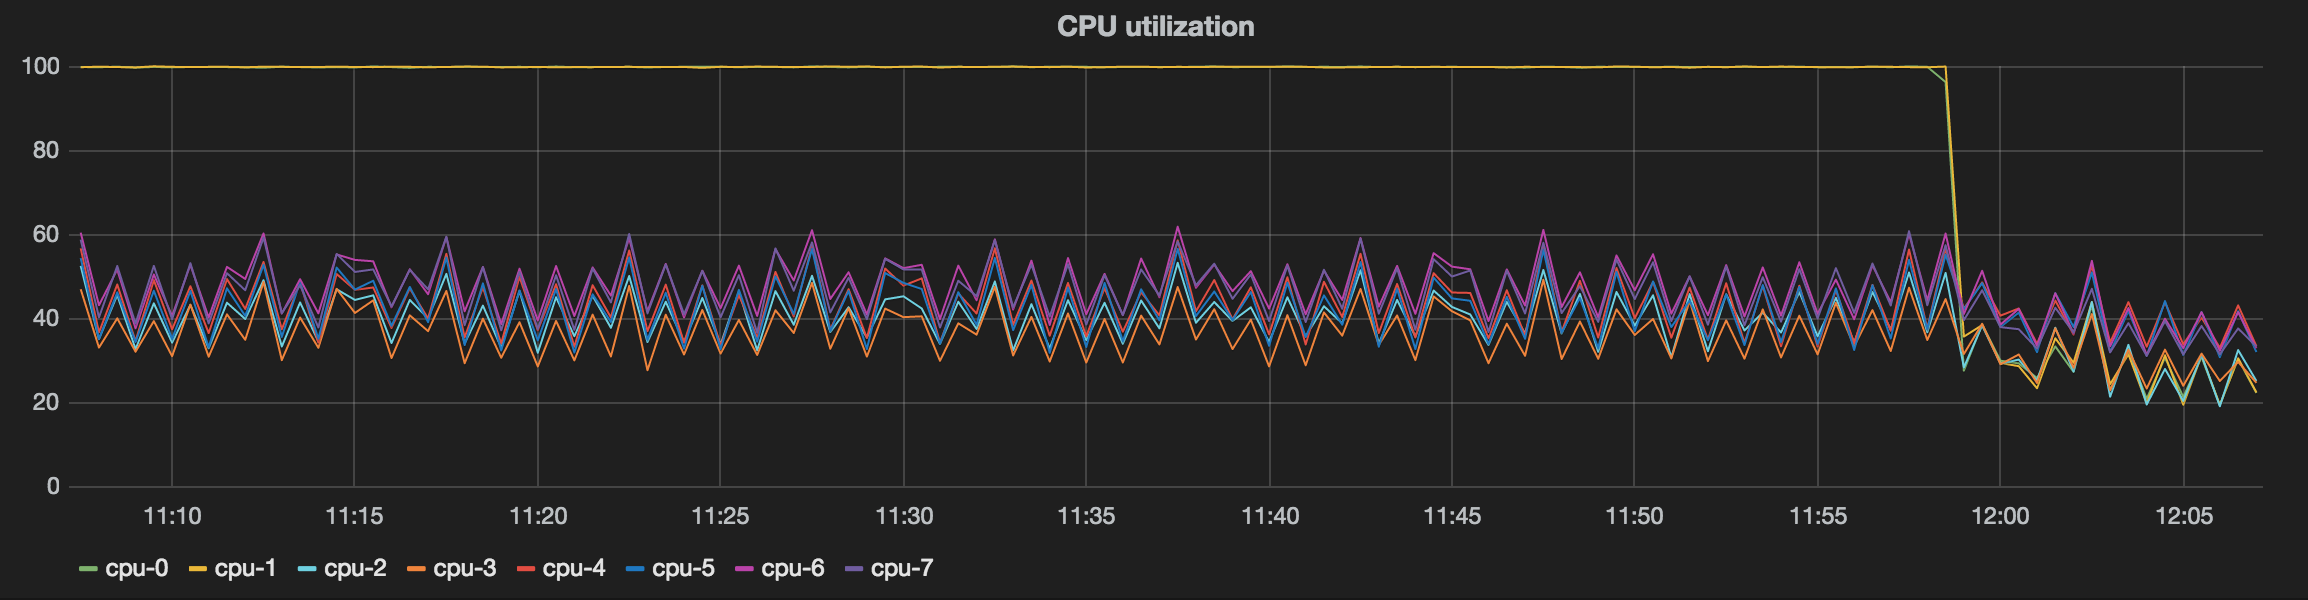
Real world load reduction - two carbon-relay daemons behind haproxy being replaced with a single Polymur instance:
Installation
Requires Go 1.6
go get -u github.com/jamiealquiza/polymur/...go install github.com/jamiealquiza/polymur/cmd/polymur- Binary will be found at
$GOPATH/bin/polymur
Usage
Polymur uses Envy to automatically accept all options as env vars (variables in brackets).
Usage of polymur:
  -api-addr string
        API listen address [POLYMUR_API_ADDR] (default "localhost:2030")
  -console-out
        Dump output to console [POLYMUR_CONSOLE_OUT]
  -destinations string
        Comma-delimited list of ip:port destinations [POLYMUR_DESTINATIONS]
  -distribution string
        Destination distribution methods: broadcast, hash-route [POLYMUR_DISTRIBUTION] (default "broadcast")
  -incoming-queue-cap int
        In-flight incoming message queue capacity (number of data point batches [100 points max per batch]) [POLYMUR_INCOMING_QUEUE_CAP] (default 32768)
  -listen-addr string
        Polymur listen address [POLYMUR_LISTEN_ADDR] (default "0.0.0.0:2003")
  -metrics-flush int
        Graphite flush interval for runtime metrics (0 is disabled) [POLYMUR_METRICS_FLUSH]
  -outgoing-queue-cap int
        In-flight message queue capacity per destination (number of data points) [POLYMUR_OUTGOING_QUEUE_CAP] (default 4096)
  -stat-addr string
        runstats listen address [POLYMUR_STAT_ADDR] (default "localhost:2020")
Examples
Running
Listening for incoming metrics on 0.0.0.0:2003 and mirroring to 10.0.5.20:2003 and 10.0.5.30:2003:
./polymur -destinations="10.0.5.20:2003,10.0.5.30:2003" -metrics-flush=30 -"listen-addr=0.0.0.0:2003" -distribution="broadcast"
2015/05/14 15:19:08 ::: Polymur :::
2015/05/14 15:19:08 Registered destination 10.0.5.20:2003
2015/05/14 15:19:08 Registered destination 10.0.5.30:2003
2015/05/14 15:19:08 Adding destination to connection pool: 10.0.5.30:2003
2015/05/14 15:19:08 Adding destination to connection pool: 10.0.5.20:2003
2015/05/14 15:19:09 API started: localhost:2030
2015/05/14 15:19:09 Runstats started: localhost:2020
2015/05/14 15:19:09 Metrics listener started: 0.0.0.0:2003
2015/05/14 15:19:14 Last 5s: Received 7276 data points | Avg: 1455.20/sec.
2015/05/14 15:19:19 Last 5s: Received 6471 data points | Avg: 1294.20/sec.
2015/05/14 15:19:24 Last 5s: Received 6744 data points | Avg: 1348.80/sec.
2015/05/14 15:19:29 Last 5s: Received 5806 data points | Avg: 1161.20/sec.
Changing destinations
Polymur started with no initial destinations:
./polymur
2015/05/14 09:09:15 ::: Polymur :::
2015/05/14 09:09:15 Metrics listener started: 0.0.0.0:2003
2015/05/14 09:09:15 API started: localhost:2030
2015/05/14 09:09:15 Runstats started: localhost:2020
% echo getdest | nc localhost 2030
{
 "active": [],
 "registered": {}
}
Add destination at runtime:
% echo putdest localhost:6020 | nc localhost 2030
Registered destination: localhost:6020
2015/05/14 09:09:23 Registered destination localhost:6020
2015/05/14 09:09:23 Adding destination to connection pool: localhost:6020
% echo getdest | nc localhost 2030
{
 "active": [
  "localhost:6020"
 ],
 "registered": {
  "localhost:6020": "2015-05-14T09:09:23.620410265-06:00"
 }
}
Internals
Terminology:
- Destination: where metrics will be forwarded using the Graphite plaintext protocol
- Destination queue: metrics in-flight for a given destination
- Registered: a candidate destination loaded into Polymur, but not necessarily active
- Connection: a registered destination with an active connection
- Connection pool: global list of all active connections and their respective destination queue
- Distribution mode: how metrics are distributed to destinations (broadcast, hash-route)
- Retry queue: messages that couldn't be sent to their destination are loaded into the retry queue and retried on remaining active connections
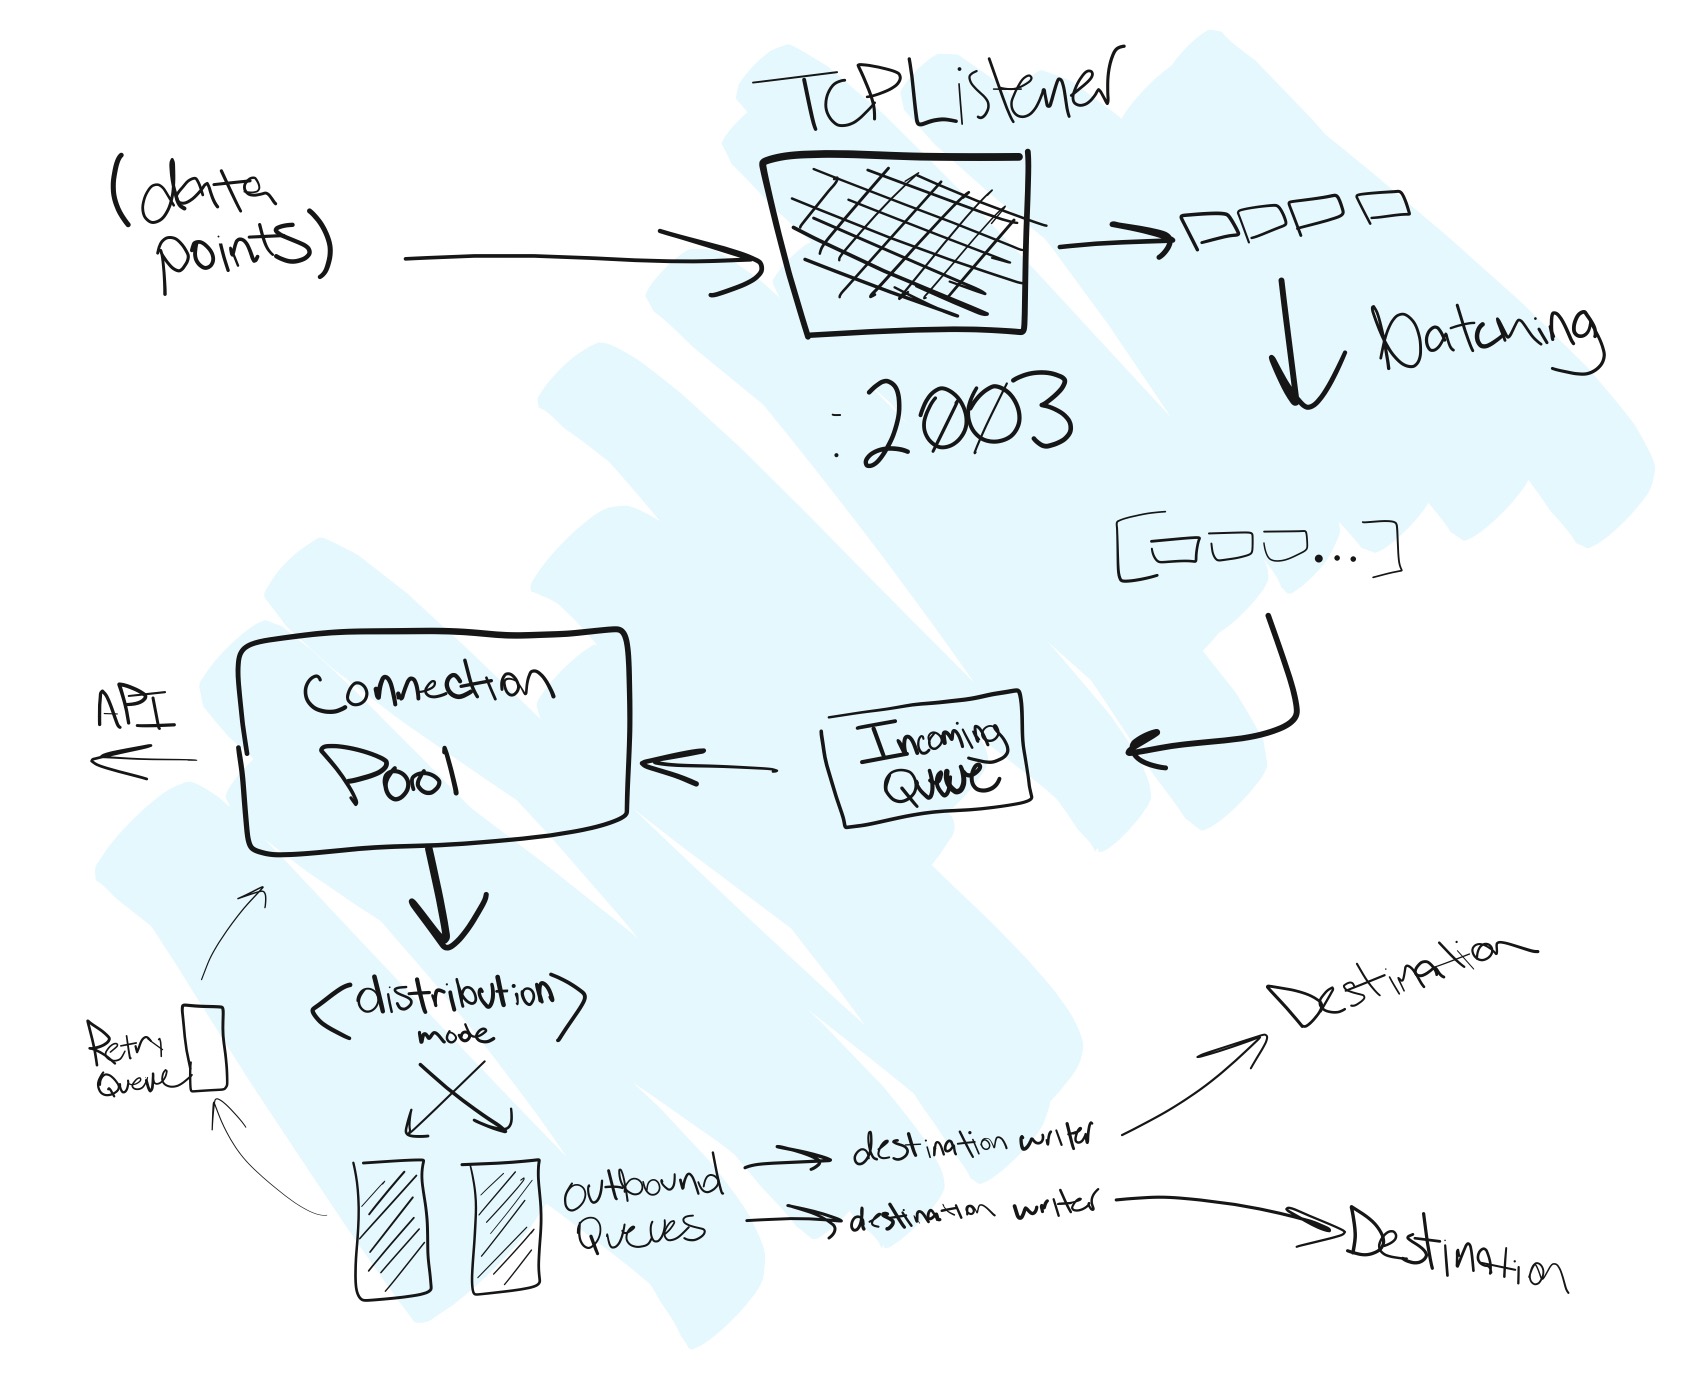
Polymur listens on the configured addr:port for incoming connections, each connection handled in a dedicated Goroutine. A connection Goroutine reads the inbound stream and allocates a message string at LF boundaries. Messages are batched and flushed on size and time thresholds.
Message batches from the inbound queue are then distributed (broadcast or hash-routed) to a dedicated queue for each output destination. Destination output is also handled using dedicated Goroutines, where transient latency or full disconnects to one destination will not impact write performance to another destination. If a destination becomes unreachable, the endpoint will be retried at 10 second intervals while the respective destination queue buffers new incoming messages. Per destination queue capacity is determined by the -queue-cap directive. Any destination queue with an outstanding length greater than 0 will be logged to stdout. Any destination queue that exceeds the configured -queue-cap will not receive any new messages until the queue is cleared. If the distribution mode is configured as hash-route, three consecutive reconnect attempt failures will result in removing the connection from the connection pool and redistributing any in-flight messages to a retry-queue for distribution to remaining healthy destinations.
Diagram: