All Projects → plotly → Dash Table

plotly / Dash Table

Licence: mit
A First-Class Interactive DataTable for Dash

Programming Languages

python
139335 projects - #7 most used programming language
typescript
32286 projects

Projects that are alternatives of or similar to Dash Table

Dashr
Dash for R - An R interface to the Dash ecosystem for creating analytic web applications
Stars: ✭ 337 (-11.78%)
Mutual labels:  data-science, plotly-dash, dash, data-visualization, plotly
Dash
Analytical Web Apps for Python, R, Julia, and Jupyter. No JavaScript Required.
Stars: ✭ 15,592 (+3981.68%)
Mutual labels:  data-science, plotly-dash, dash, data-visualization, plotly
Dash Docs
📖 The Official Dash Userguide & Documentation
Stars: ✭ 338 (-11.52%)
Mutual labels:  data-science, plotly-dash, dash, data-visualization, plotly
Dash.jl
Dash for Julia - A Julia interface to the Dash ecosystem for creating analytic web applications in Julia. No JavaScript required.
Stars: ✭ 248 (-35.08%)
Mutual labels:  data-science, plotly-dash, dash, data-visualization, plotly
Dash Oil And Gas Demo
Dash Demo App - New York Oil and Gas
Stars: ✭ 156 (-59.16%)
Mutual labels:  data-science, dash, data-visualization, plotly
Dash Stock Tickers Demo App
Dash Demo App - Stock Tickers
Stars: ✭ 108 (-71.73%)
Mutual labels:  data-science, dash, data-visualization, plotly
Slapdash
Boilerplate for bootstrapping scalable multi-page Dash applications
Stars: ✭ 225 (-41.1%)
Mutual labels:  plotly-dash, dash, data-visualization, plotly
Fitly
Self hosted web analytics for endurance athletes
Stars: ✭ 65 (-82.98%)
Mutual labels:  plotly-dash, dash, data-visualization, plotly
Dash Cytoscape
Interactive network visualization in Python and Dash, powered by Cytoscape.js
Stars: ✭ 309 (-19.11%)
Mutual labels:  data-science, plotly-dash, dash, plotly
Py Quantmod
Powerful financial charting library based on R's Quantmod | http://py-quantmod.readthedocs.io/en/latest/
Stars: ✭ 155 (-59.42%)
Mutual labels:  data-science, data-visualization, plotly
Dtale
Visualizer for pandas data structures
Stars: ✭ 2,864 (+649.74%)
Mutual labels:  data-science, plotly-dash, data-visualization
Cryptocurrency Analysis Python
Open-Source Tutorial For Analyzing and Visualizing Cryptocurrency Data
Stars: ✭ 278 (-27.23%)
Mutual labels:  data-science, data-visualization, plotly
Plotly Graphing Library For Matlab
Plotly Graphing Library for MATLAB®
Stars: ✭ 234 (-38.74%)
Mutual labels:  data-science, data-visualization, plotly
Tablesaw
Java dataframe and visualization library
Stars: ✭ 2,785 (+629.06%)
Mutual labels:  data-science, data-visualization, plotly
2019-nCoV-dash
新型冠状病毒(2019-nCoV)肺炎(COVID-19)疫情展示
Stars: ✭ 13 (-96.6%)
Mutual labels:  plotly, dash, plotly-dash
Bubbly
A python package for plotting animated and interactive bubble charts using Plotly
Stars: ✭ 37 (-90.31%)
Mutual labels:  data-science, data-visualization, plotly
dash-redis-celery-periodic-updates
Demo apps now maintained in https://github.com/plotly/dash-enterprise-docs
Stars: ✭ 47 (-87.7%)
Mutual labels:  plotly, dash, plotly-dash
Dash Sample Apps
Open-source demos hosted on Dash Gallery
Stars: ✭ 2,090 (+447.12%)
Mutual labels:  plotly-dash, dash, plotly
Plotly.js
Open-source JavaScript charting library behind Plotly and Dash
Stars: ✭ 14,268 (+3635.08%)
Mutual labels:  plotly-dash, data-visualization, plotly
dash-mantine-components
Plotly Dash components based on Mantine React Components
Stars: ✭ 263 (-31.15%)
Mutual labels:  plotly, dash, plotly-dash

Dash Table

An interactive DataTable for Dash.

👉 Documentation

Quickstart

pip install dash-table
import dash
import dash_table
import pandas as pd

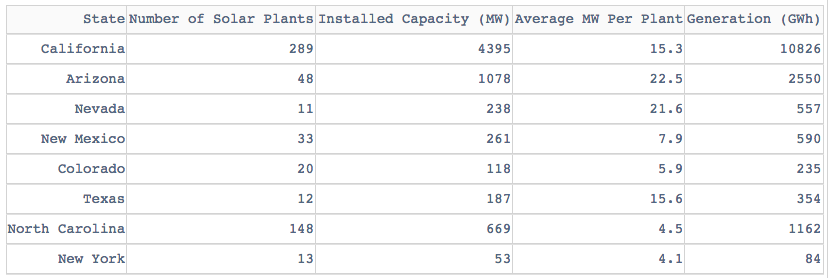
df = pd.read_csv('https://raw.githubusercontent.com/plotly/datasets/master/solar.csv')

app = dash.Dash(__name__)

app.layout = dash_table.DataTable(
    id='table',
    columns=[{"name": i, "id": i} for i in df.columns],
    data=df.to_dict('records'),
)

if __name__ == '__main__':
    app.run_server(debug=True)

Interactive Dash DataTable

Background

Dash DataTable is an interactive table component designed for viewing, editing, and exploring large datasets.

DataTable is rendered with standard, semantic HTML <table/> markup, which makes it accessible, responsive, and easy to style.

This component was written from scratch in React.js and Typescript specifically for the Dash community. Its API was designed to be ergonomic and its behavior is completely customizable through its properties.

DataTable was designed with a featureset that allows that Dash users to create complex, spreadsheet driven applications with no compromises. We're excited to continue to work with users and companies that invest in DataTable's future.

Please subscribe to dash-table#207 and the CHANGELOG.md to stay up-to-date with any breaking changes. Note: DataTable is currently supported in Chrome, Firefox, Safari, Edge (version 15+), and Internet Explorer 11.

Share your DataTable Dash apps on the community forum!

Contributing

See CONTRIBUTING.md

Note that the project description data, including the texts, logos, images, and/or trademarks, for each open source project belongs to its rightful owner. If you wish to add or remove any projects, please contact us at [email protected].