All Projects → aaronpenne → Data_visualization

aaronpenne / Data_visualization

Licence: mit
A collection of my data visualizations, mostly in Python.

Programming Languages

python
139335 projects - #7 most used programming language
python3
1442 projects

Projects that are alternatives of or similar to Data visualization

Tablesaw
Java dataframe and visualization library
Stars: ✭ 2,785 (+847.28%)
Mutual labels:  data-science, data-visualization
Cjworkbench
The data journalism platform with built in training
Stars: ✭ 244 (-17.01%)
Mutual labels:  data-science, data-visualization
Deepgraph
Analyze Data with Pandas-based Networks. Documentation:
Stars: ✭ 232 (-21.09%)
Mutual labels:  data-science, data-visualization
Streamlit
Streamlit — The fastest way to build data apps in Python
Stars: ✭ 16,906 (+5650.34%)
Mutual labels:  data-science, data-visualization
Deep Learning Machine Learning Stock
Stock for Deep Learning and Machine Learning
Stars: ✭ 240 (-18.37%)
Mutual labels:  data-science, data-visualization
Dash
Analytical Web Apps for Python, R, Julia, and Jupyter. No JavaScript Required.
Stars: ✭ 15,592 (+5203.4%)
Mutual labels:  data-science, data-visualization
Plotly Graphing Library For Matlab
Plotly Graphing Library for MATLAB®
Stars: ✭ 234 (-20.41%)
Mutual labels:  data-science, data-visualization
Chord
Python package for creating beautiful interactive Chord Diagrams. Pro version available at https://m8.fyi/chord
Stars: ✭ 217 (-26.19%)
Mutual labels:  data-science, data-visualization
Python Articles
Monthly Series - Top 10 Python Articles
Stars: ✭ 288 (-2.04%)
Mutual labels:  data-science, data-visualization
Dash.jl
Dash for Julia - A Julia interface to the Dash ecosystem for creating analytic web applications in Julia. No JavaScript required.
Stars: ✭ 248 (-15.65%)
Mutual labels:  data-science, data-visualization
Datascienceprojects
The code repository for projects and tutorials in R and Python that covers a variety of topics in data visualization, statistics sports analytics and general application of probability theory.
Stars: ✭ 223 (-24.15%)
Mutual labels:  data-science, data-visualization
Data Science Hacks
Data Science Hacks consists of tips, tricks to help you become a better data scientist. Data science hacks are for all - beginner to advanced. Data science hacks consist of python, jupyter notebook, pandas hacks and so on.
Stars: ✭ 273 (-7.14%)
Mutual labels:  data-science, data-visualization
Amazing Feature Engineering
Feature engineering is the process of using domain knowledge to extract features from raw data via data mining techniques. These features can be used to improve the performance of machine learning algorithms. Feature engineering can be considered as applied machine learning itself.
Stars: ✭ 218 (-25.85%)
Mutual labels:  data-science, data-visualization
Mydatascienceportfolio
Applying Data Science and Machine Learning to Solve Real World Business Problems
Stars: ✭ 227 (-22.79%)
Mutual labels:  data-science, data-visualization
Gwu data mining
Materials for GWU DNSC 6279 and DNSC 6290.
Stars: ✭ 217 (-26.19%)
Mutual labels:  data-science, data-visualization
Datascience
Curated list of Python resources for data science.
Stars: ✭ 3,051 (+937.76%)
Mutual labels:  data-science, data-visualization
Gradio
Create UIs for your machine learning model in Python in 3 minutes
Stars: ✭ 4,358 (+1382.31%)
Mutual labels:  data-science, data-visualization
Klib
Easy to use Python library of customized functions for cleaning and analyzing data.
Stars: ✭ 192 (-34.69%)
Mutual labels:  data-science, data-visualization
Orange3
🍊 📊 💡 Orange: Interactive data analysis
Stars: ✭ 3,152 (+972.11%)
Mutual labels:  data-science, data-visualization
Awesome Datascience
📝 An awesome Data Science repository to learn and apply for real world problems.
Stars: ✭ 17,520 (+5859.18%)
Mutual labels:  data-science, data-visualization

This is a collection of my data visualizations, mostly made with Python.

Check out my generative artwork and source code as well!

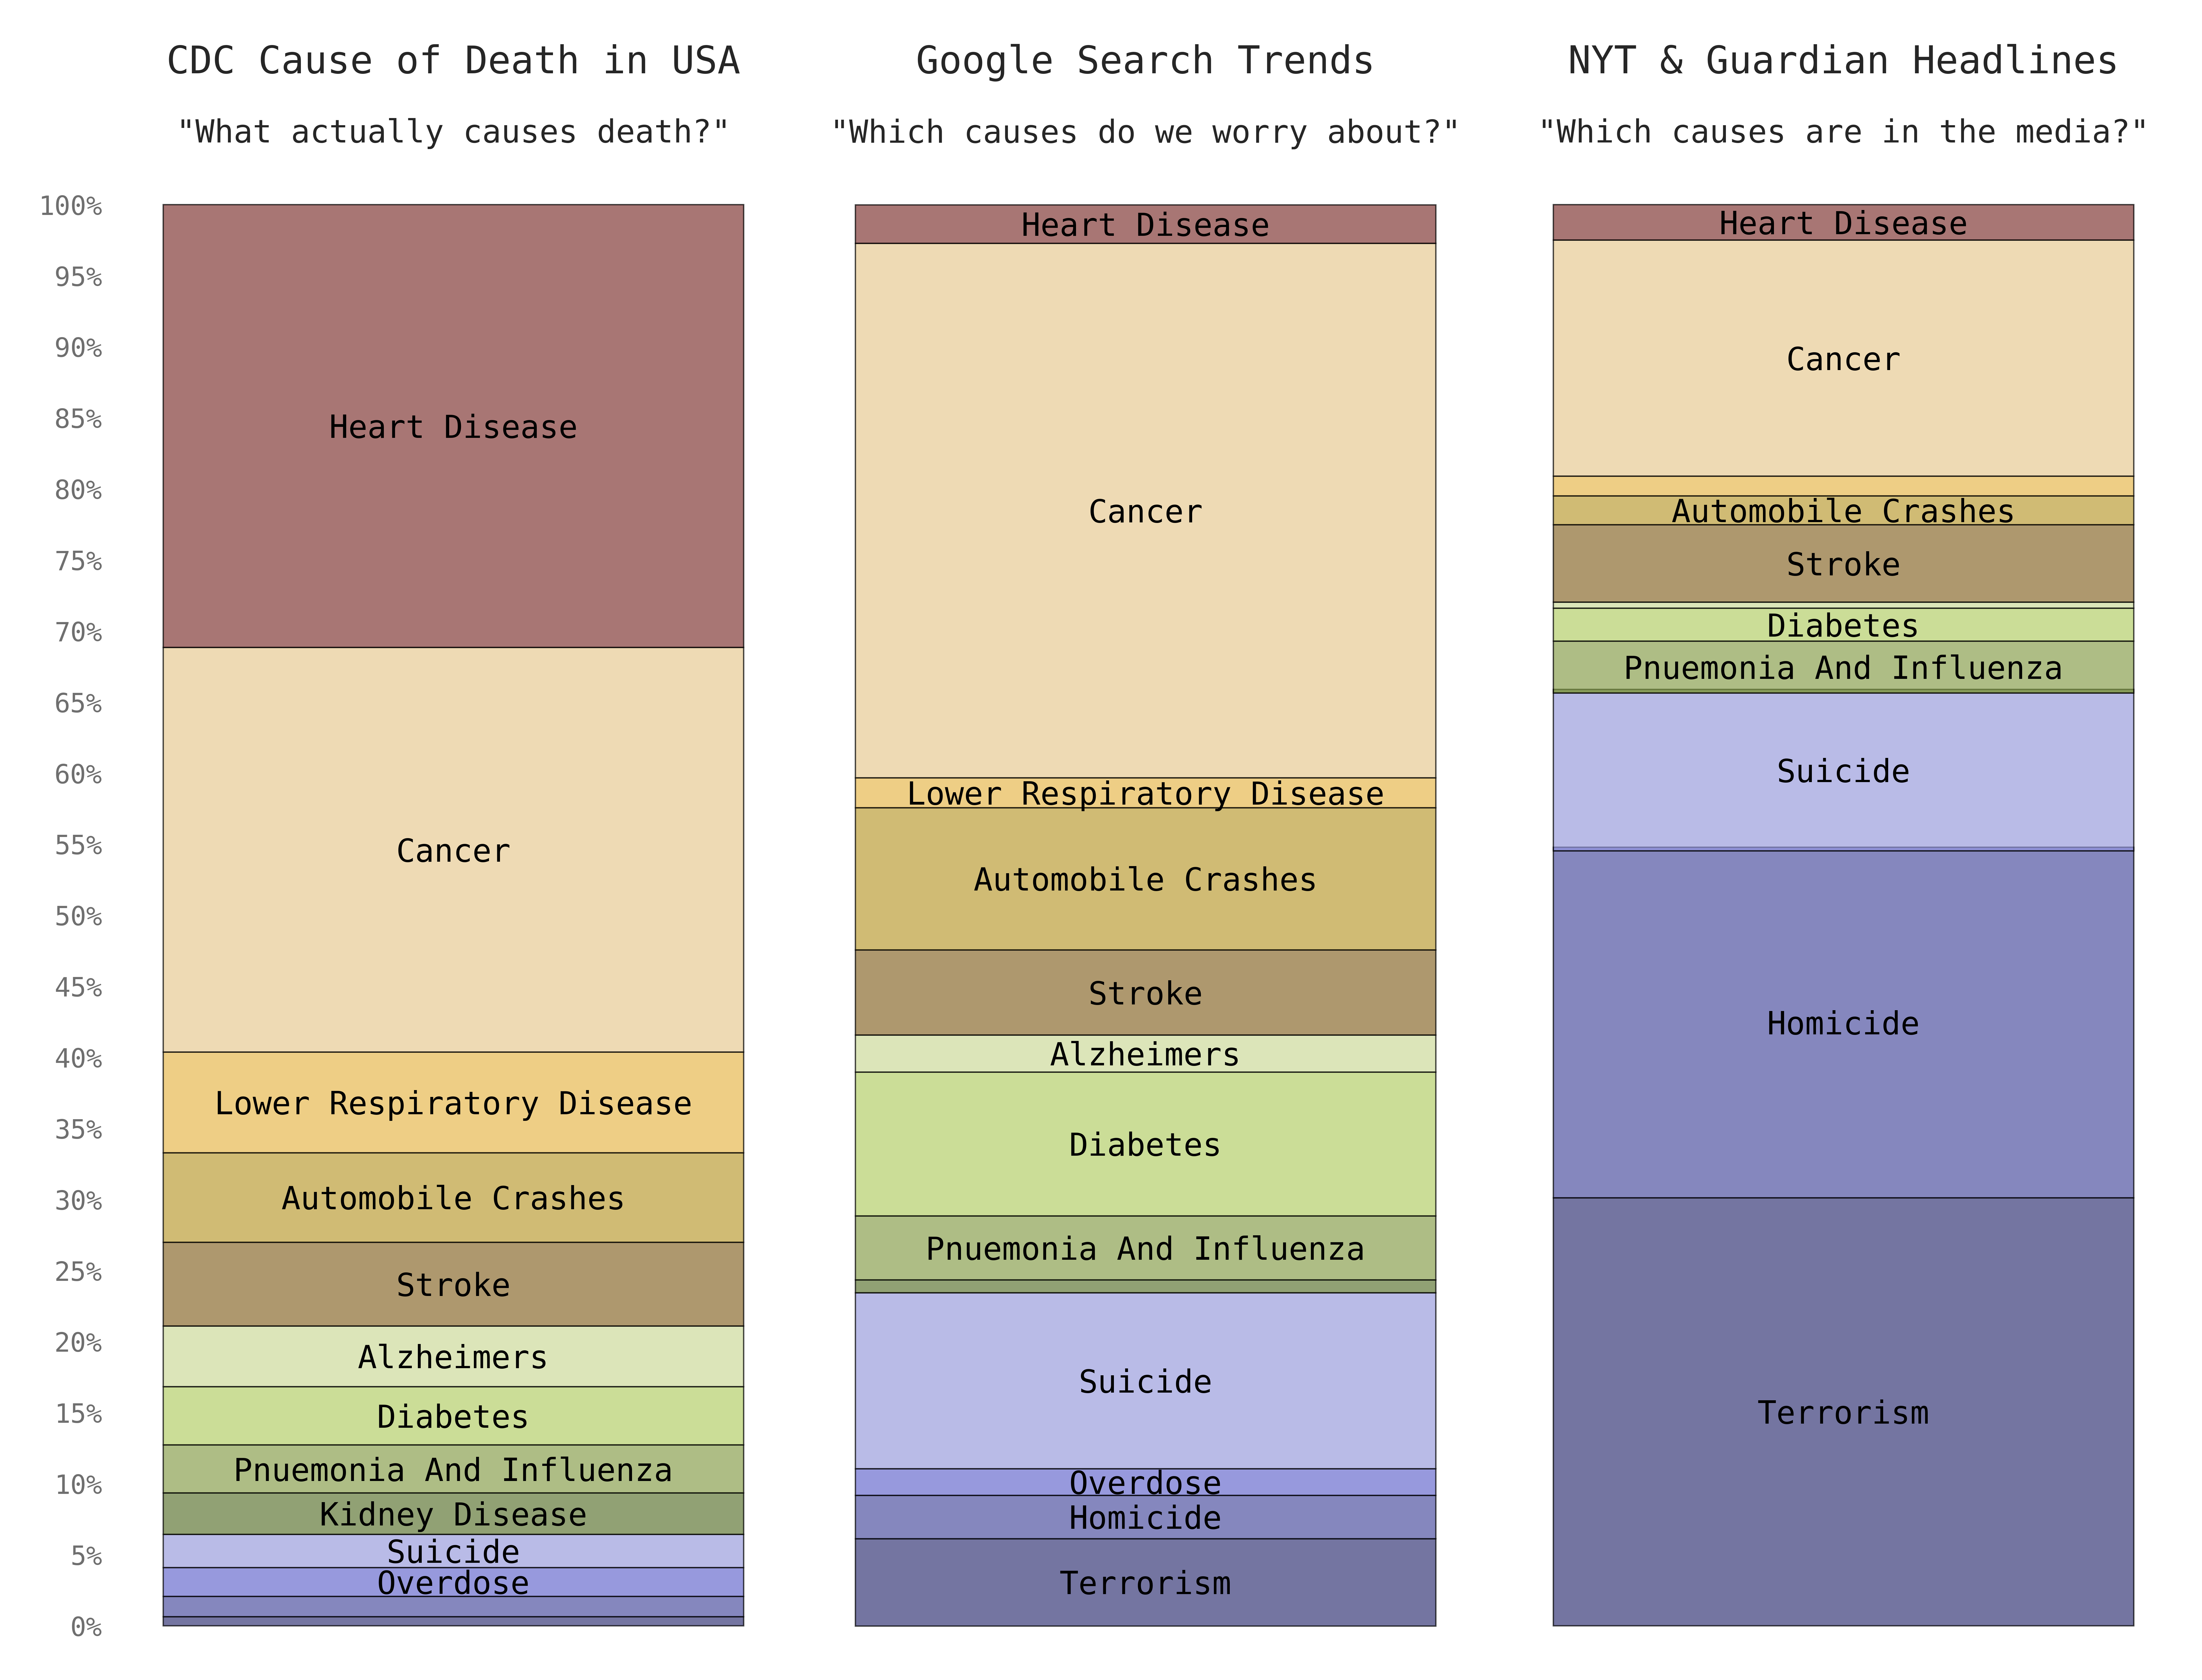
Cause of Death - Reality vs. Google vs. Media

Animated stacked bar chart - COD

This animation is an expansion on the excellent write up by Hasan Al-Jamaly, Maximillian Siemers, Owen Shen, and Nicole Stone for a project in Brad Voytek's UCSD course. The writeup can be found here: https://owenshen24.github.io/charting-death/

Here's a static version updated for publishing in an upcoming data viz book by Spanner Books:

triple bar chart - COD

Code: bar_cod.py

Data: Death: Reality vs. Reported

USA Births Per Month

The parts that stand out to me are the two big bumps 9 months after Pearl Harbor and 9 months after the war ended in Sep 1945. Those bumps are so big that the full chart pretty much only shows Baby Boomers.

Births Per Month in the USA - Heat Map

Births Per Month in the USA - Line Chart

Births Per Month in the USA - Box Plot

Births Per Month in the USA - Heat Map (Ranged)

Code: birth_heatmap.py

Birth data: Human Mortality Database

Population data: US Census Bureau

Population data (aggregated): USA_Population_of_States_US_Census_Intercensal_Tables_1917-2017.csv

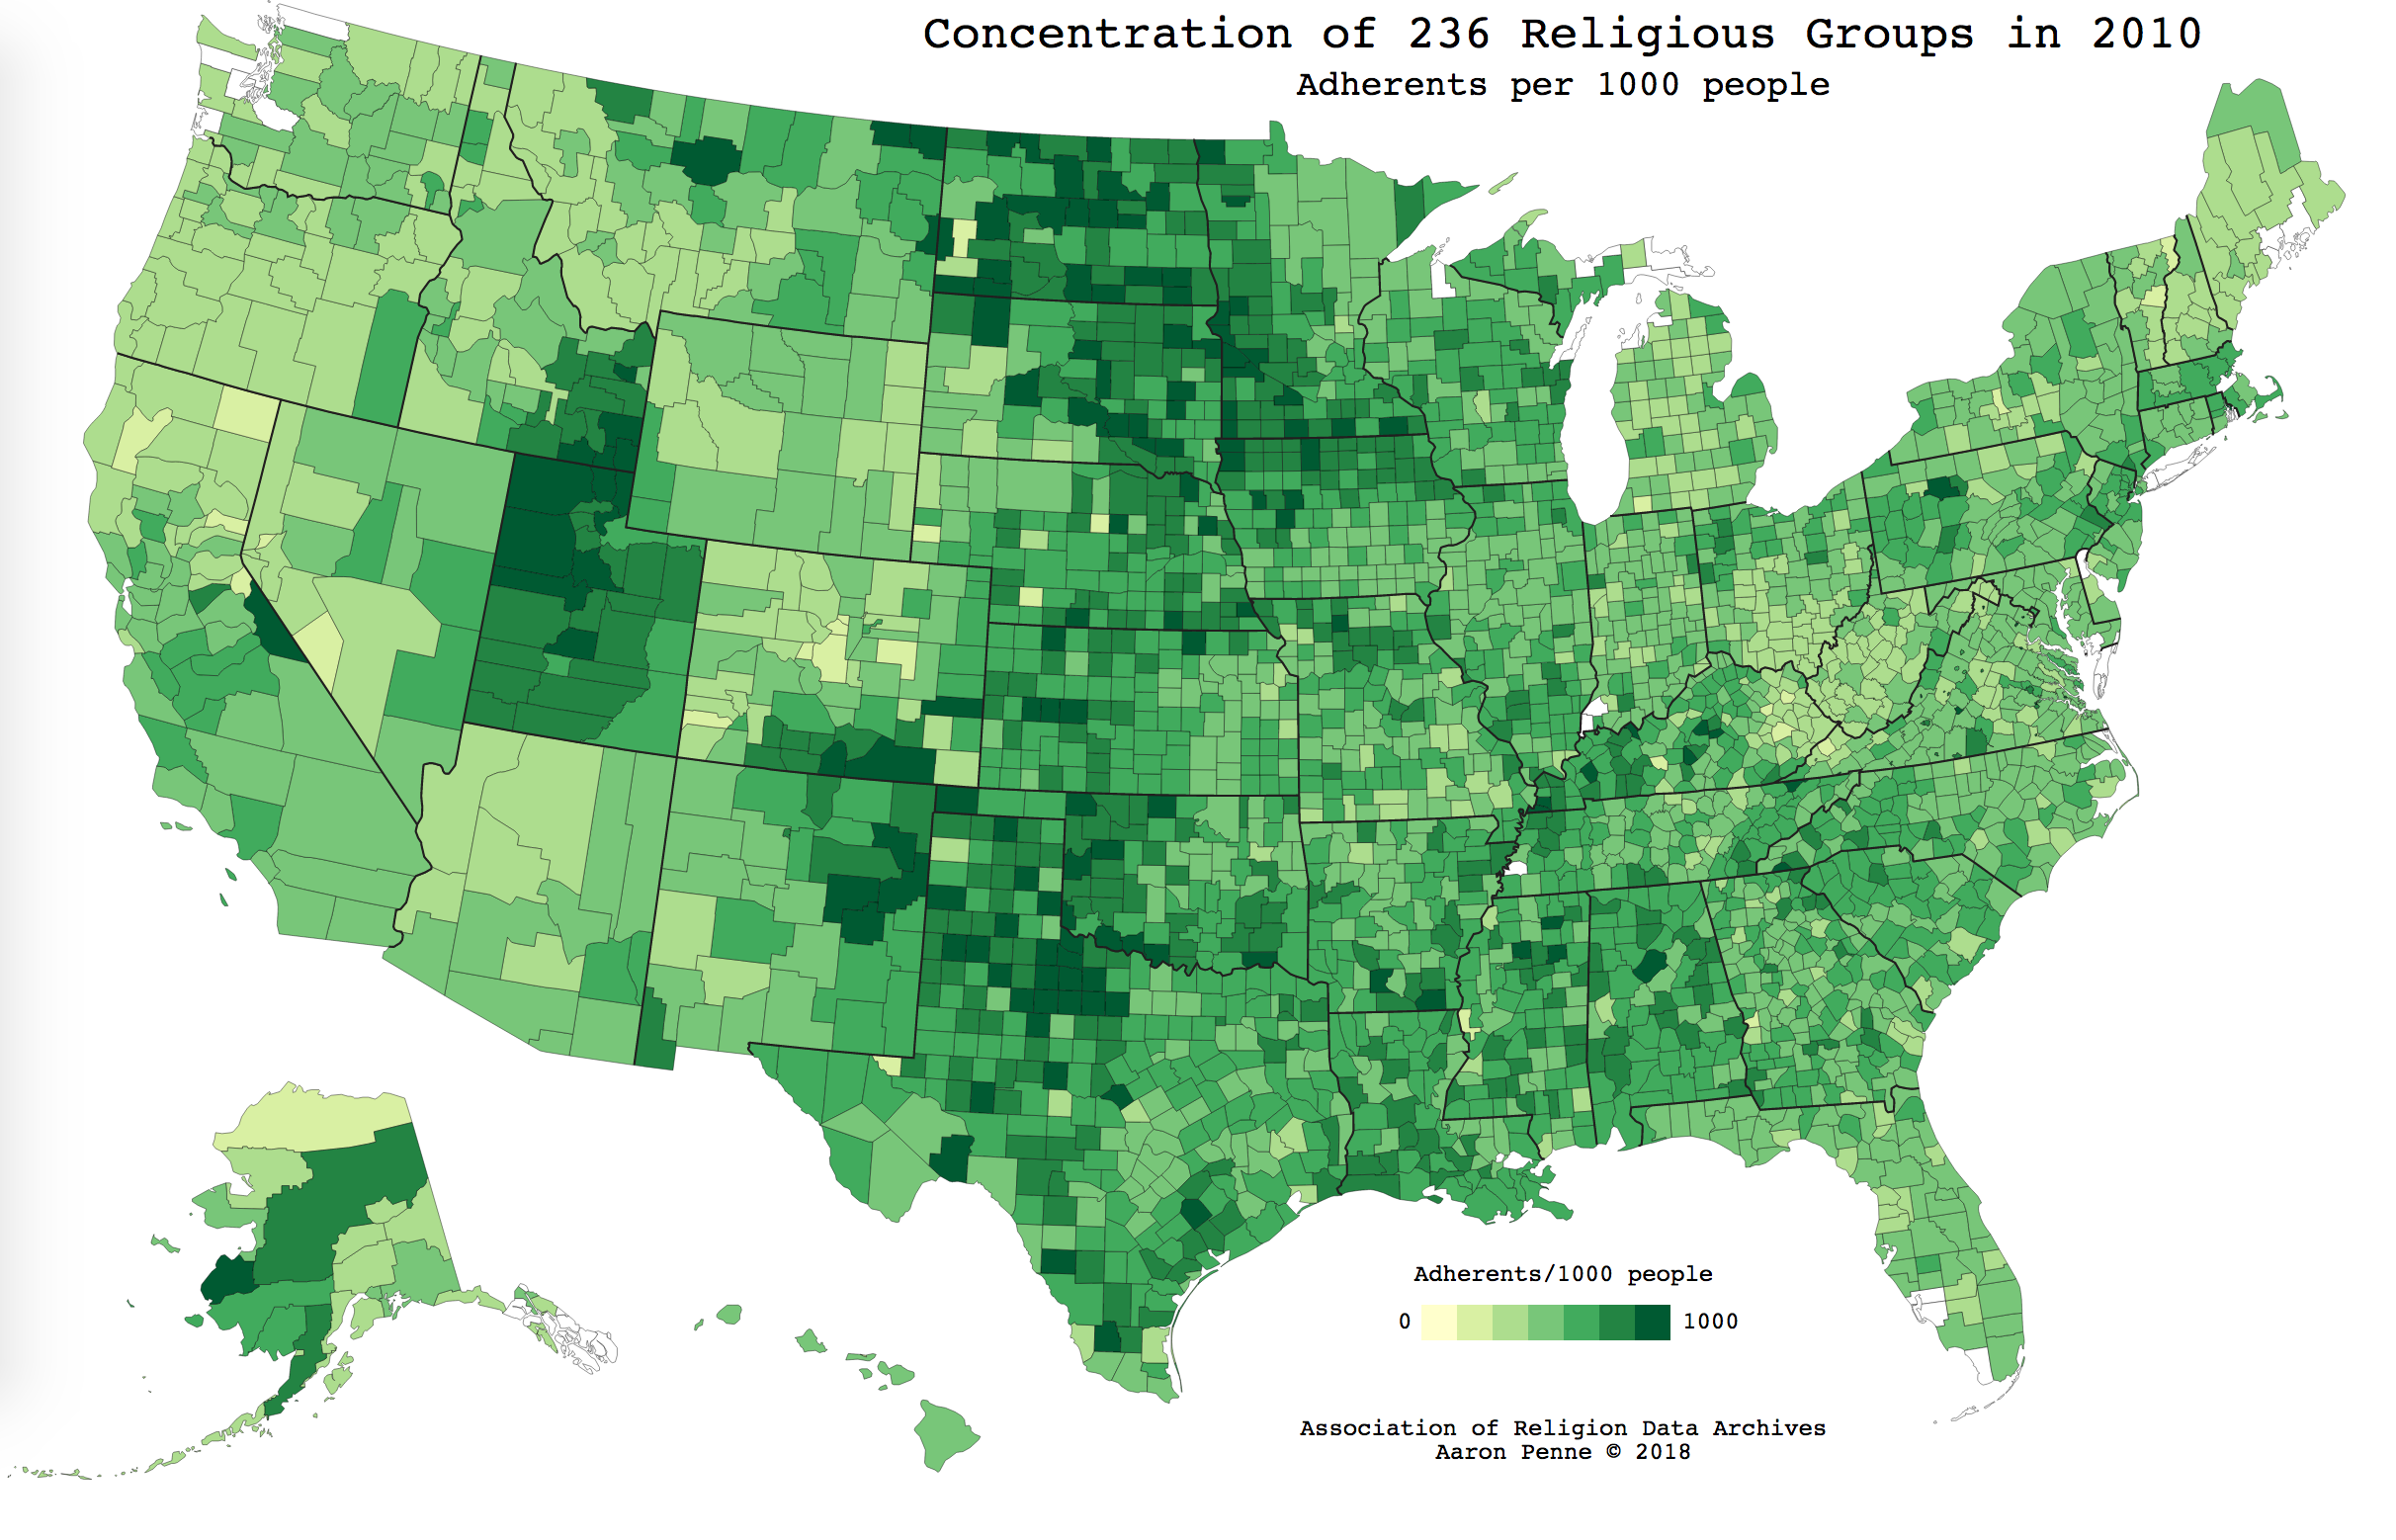
Mapping Religion

religion map

This was created as an example of 'coloring in' a premade SVG file. The SVG map of US counties was obtained from Wikimedia

Code: religion_county.py

Data: The Association of Religion Data Archives

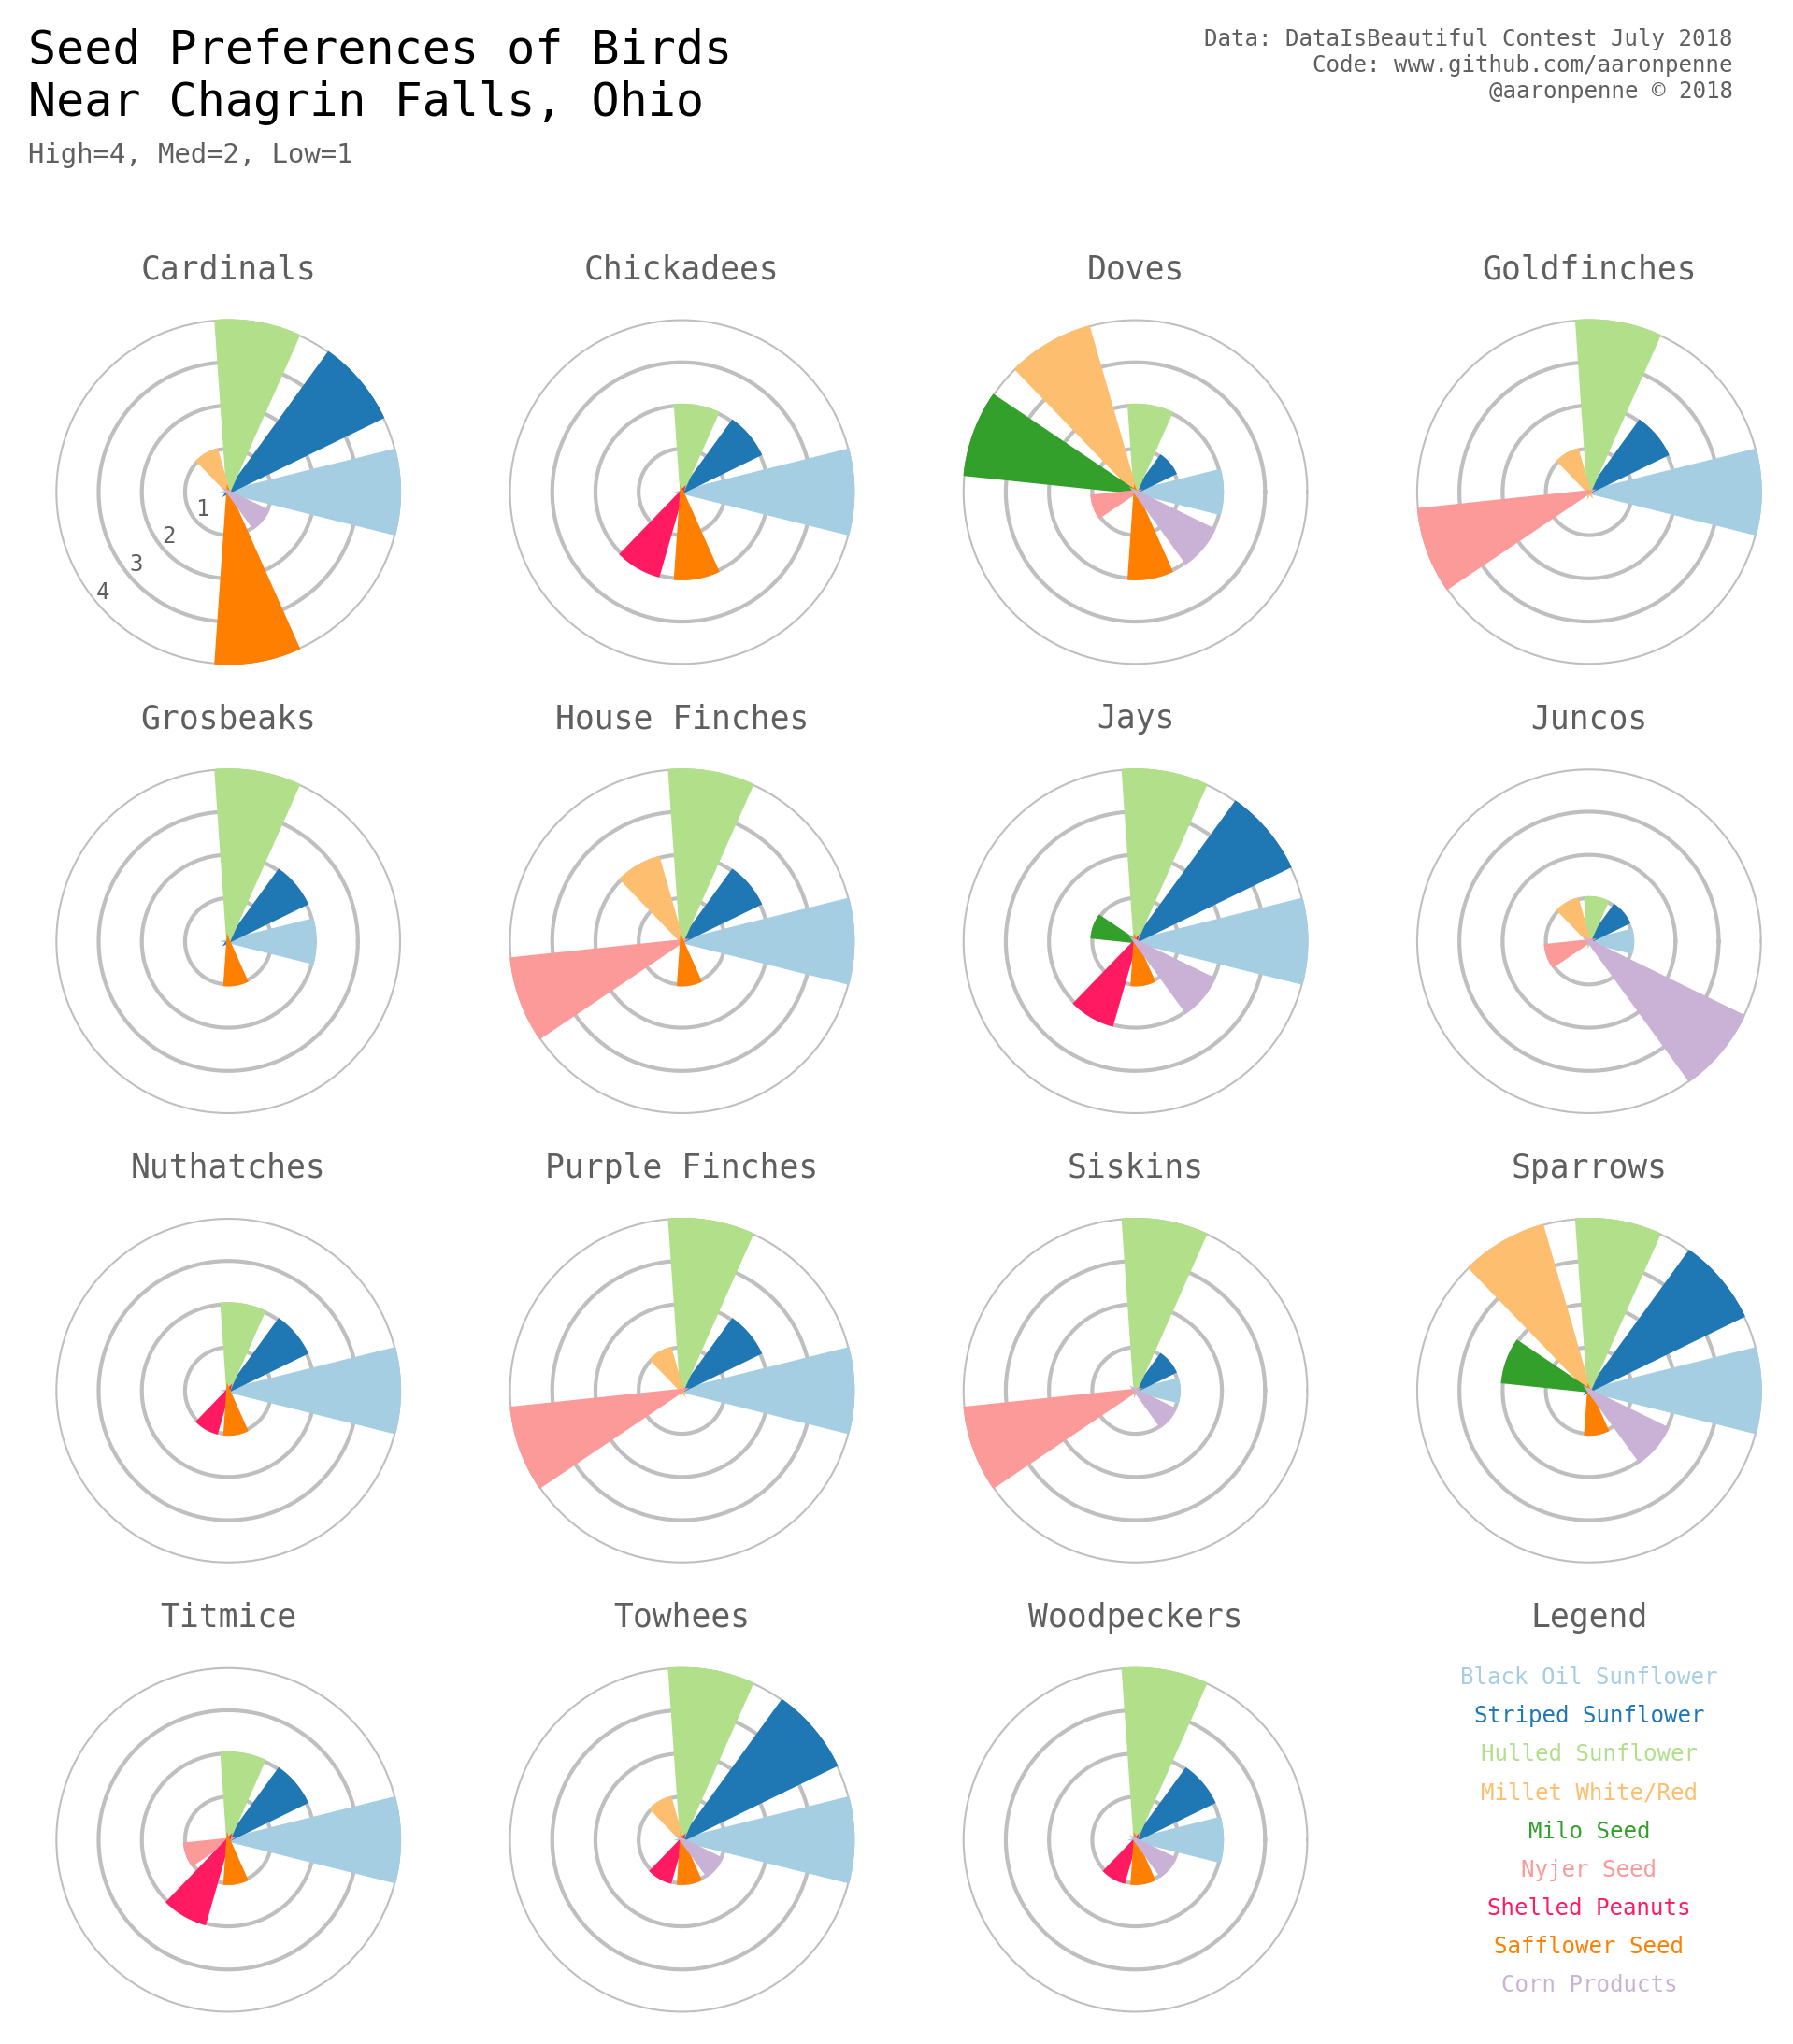
Bird Seed Preferences

birdseed charts

The July 2018 r/DataIsBeautiful competition was based around improving a grid heatmap type of chart. If this was for work, those would be regular bar charts, but this was an exercise in coercing matplotlib into plotting bar charts on polar coordinates.

Code: polar_multiples.py

Data: Hardcoded from this image

Subreddit Traffic

dataisbeautiful time

dataisbeautiful day

'users_here' counts were scraped every 10 minutes from a few subreddits over the past couple weeks. Each subreddit has 3 charts: raw line chart, box plot by day of week, and box plot by 30 minute bins. Using this data, you could time posts, chat at peak times, etc. The janky but working scraper is here. More charts for 15 or so subreddits are here.

Code: traffic.py

Data: Scraped every 10 minutes with simple script.

The Night Sky (HYG Database)

HYG Scatter Plot Twinkling

Code: hyg_scatter.py

Data: HYG Stellar Database v3

Contest: r/DataIsBeautiful DataViz Battle 2018-03

State Same Sex Marriage Laws in the USA

State Same Sex Marriage Laws in the USA - Violin

Code: ssm_violin.py

State Same Sex Marriage Laws in the USA - Joy

Code: ssm_joy.py

Data: Pew Research Center via DataViz Battle Feb 2018

Contest: r/DataIsBeautiful DataViz Battle 2018-02

Contest entry: Reddit post - Honorable Mention

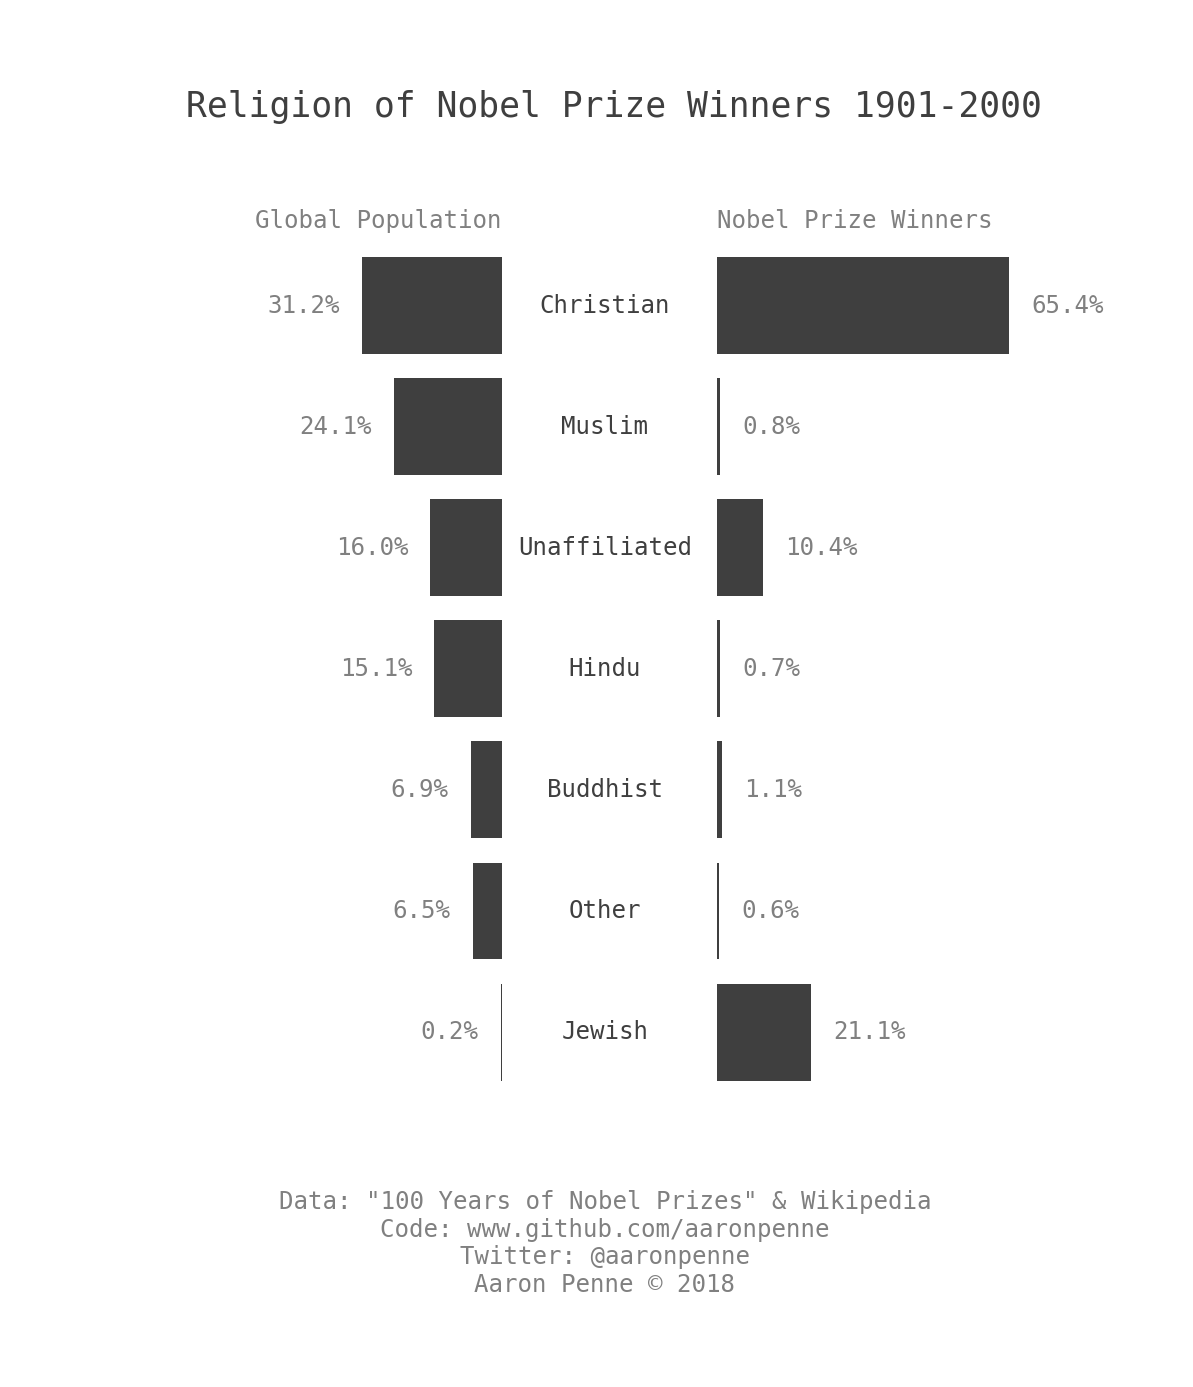
Religion of Nobel Prize Winners

Nobel Prize vs Population

This bar chart was an exercise in replotting the 3D exploded pie chart that appeared here. Data is the same, but augmented with population data to show how certain religions are over/under represented.

Code: nobel_pop_bar.py

Data: Nobel Prize data and Global Population data from Wikipedia

Our Living Planet

EVI Animated Map

This GIF is shortened from the full dataset of 18 years to only 2 years due to file size restrictions. Full resolution videos from 2000-2018 are on YouTube.

All credit for the imagery products go to the NASA MODIS Science Team. I only collected the images into animations and annotated them.

Code: modis_vegetation.py

Data: NASA MODIS Sensor on Terra Satellite LP DAAC

Annual Company Revenue vs. Annual CEO Compensation

Annual Company Revenue vs. Annual CEO Compensation - Dot Pairs

Code: dot_pairs_ceo_compensation.py

Data: Reddit post by u/k0m0d0z0

USA Population Rankings

USA Population Rankings - Bump Chart

Code: pop_joy.py

Data (raw): https://census.gov/data/tables/time-series/demo/popest/pre-1980-state.html

Data (manually aggregated/cleaned): USA_Population_of_States_US_Census_Intercensal_Tables_1917-2017.csv

Note that the project description data, including the texts, logos, images, and/or trademarks, for each open source project belongs to its rightful owner. If you wish to add or remove any projects, please contact us at [email protected].