pesos / Grofer
Projects that are alternatives of or similar to Grofer
Grofer
A clean and modern system and resource monitor written purely in golang using termui and gopsutil!
Currently compatible with Linux only.
Currently compatible with Linux only.
Installation
Using go get:
go get -u github.com/pesos/grofer
As an executable:
curl -sSL https://github.com/pesos/grofer/releases/download/<version tag>/grofer_<architecture> --output grofer
chmod +x grofer
architecture: underlying system architecture on which grofer will be run
- grofer_386
- grofer_amd64
- grofer_arm
- grofer_arm64
For system wide usage, install grofer to a location on $PATH, e.g. /usr/local/bin
mv grofer /usr/local/bin
Building from source:
git clone https://github.com/pesos/grofer
cd grofer
go build grofer.go
Shell Completions
grofer includes a subcommand to generate shell completion scripts to get autocompletion for subcommands and flags
Bash
To get completions for current session only,
source <(grofer completion bash)
To load completions for each session, the generated script must be moved to the completions directory. Take a look at the third question here to find out the right place to put the script
Zsh
If shell completion is not already enabled in your environment you will need to enable it. You can execute the following once:
echo "autoload -U compinit; compinit" >> ~/.zshrc
To load completions for each session, the generated script must be placed in a directory in your fpath. For a quick-and-dirty solution, run once:
grofer completion zsh > "${fpath[1]}/_grofer"
You will need to start a new shell for this setup to take effect.
Fish
To get completions for current session only,
grofer completion fish | source
To load completions for each session, the generated script must be moved to the completions directory
grofer completion fish > ~/.config/fish/completions/grofer.fish
Usage
grofer is a system and resource monitor written in golang.

While using a TUI based command, press ? to get information about key bindings (if any) for that command.

Usage:
  grofer [flags]
  grofer [command]

Available Commands:
  about       about is a command that gives information about the project in a cute way
  completion  Generate completion script
  export      Used to export profiled data.
  help        Help about any command
  proc        proc command is used to get per-process information

Flags:
      --config string   config file (default is $HOME/.grofer.yaml)
  -c, --cpuinfo         Info about the CPU Load over all CPUs
  -h, --help            help for grofer
  -r, --refresh uint    Overall stats UI refreshes rate in milliseconds greater than 1000 (default 1000)
  -t, --toggle          Help message for toggle

Use "grofer [command] --help" for more information about a command.
Examples
grofer [-r refreshRate] [-c]
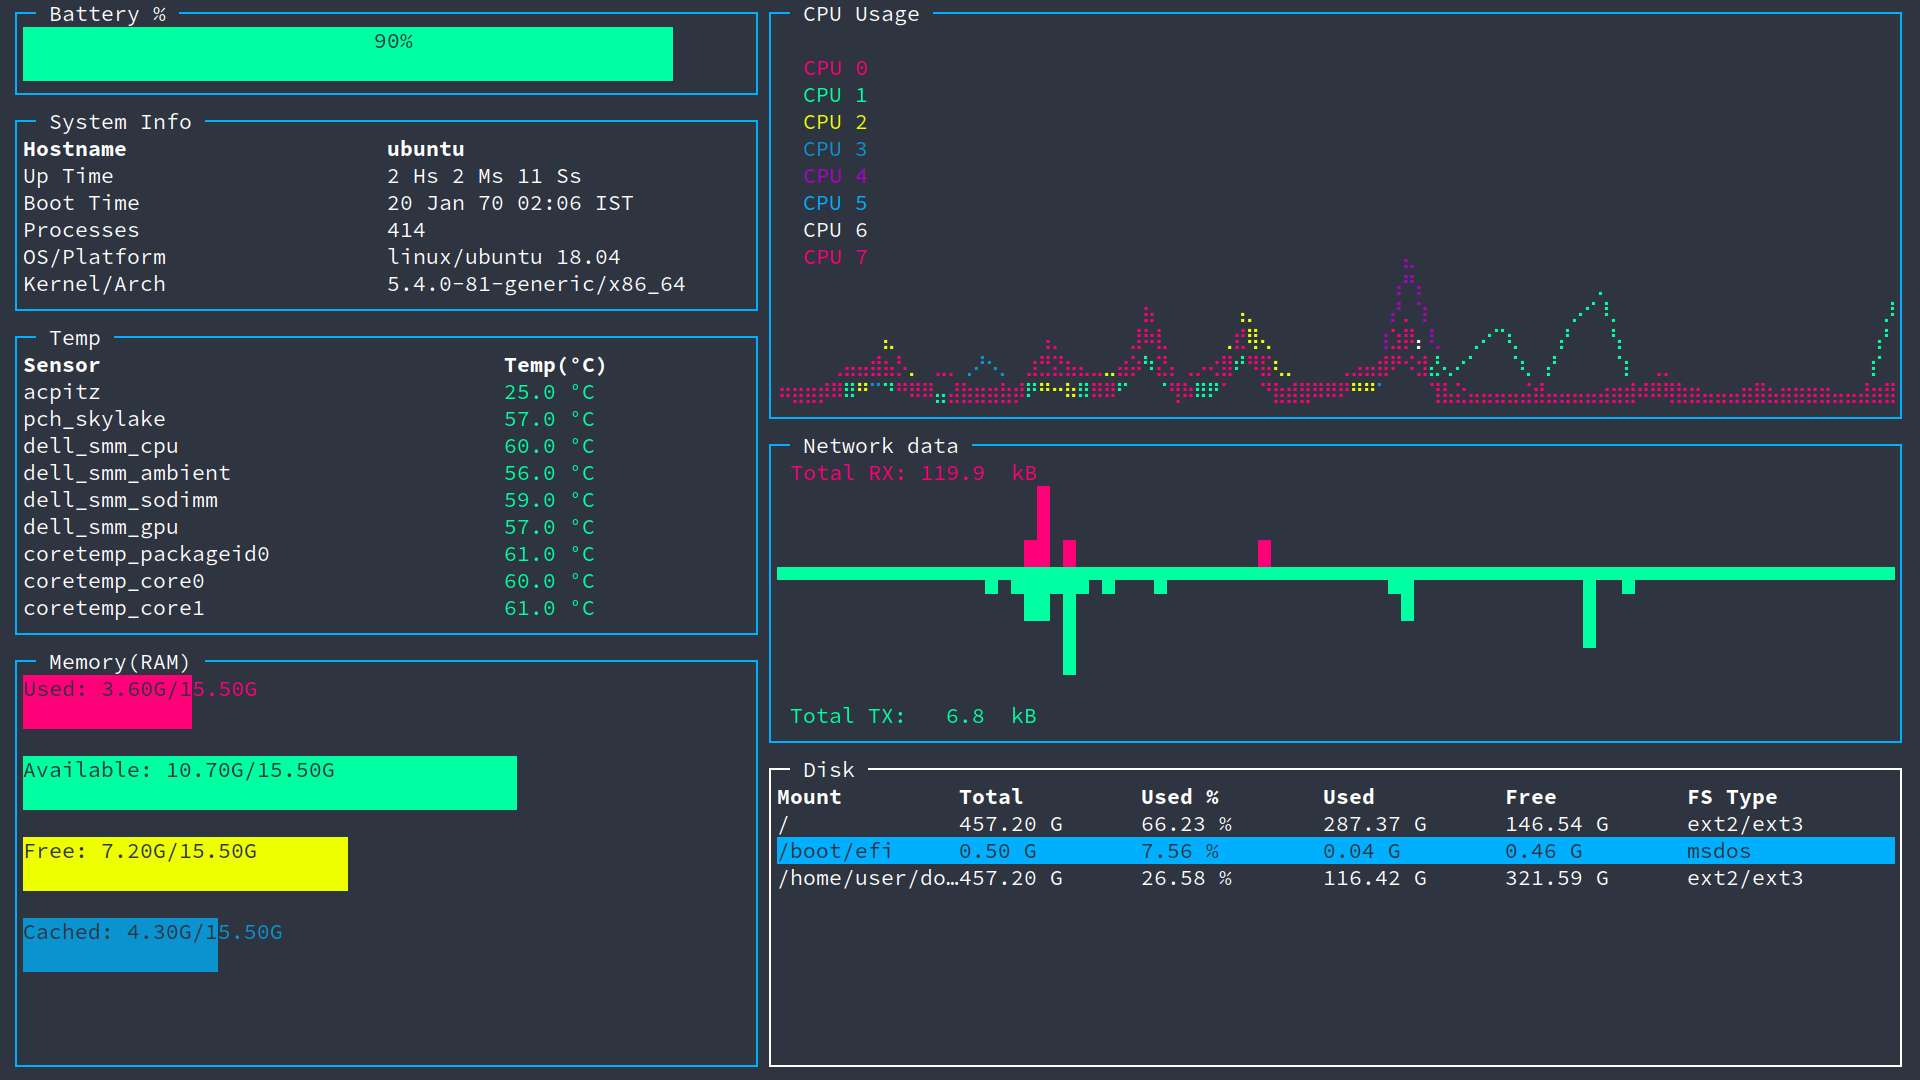
This gives overall utilization stats refreshed every refreshRate milliseconds. Default and minimum value of the refresh rate is 1000 ms.
Information provided:
- CPU utilization per core
- Memory (RAM) usage
- Network usage
- Disk storage
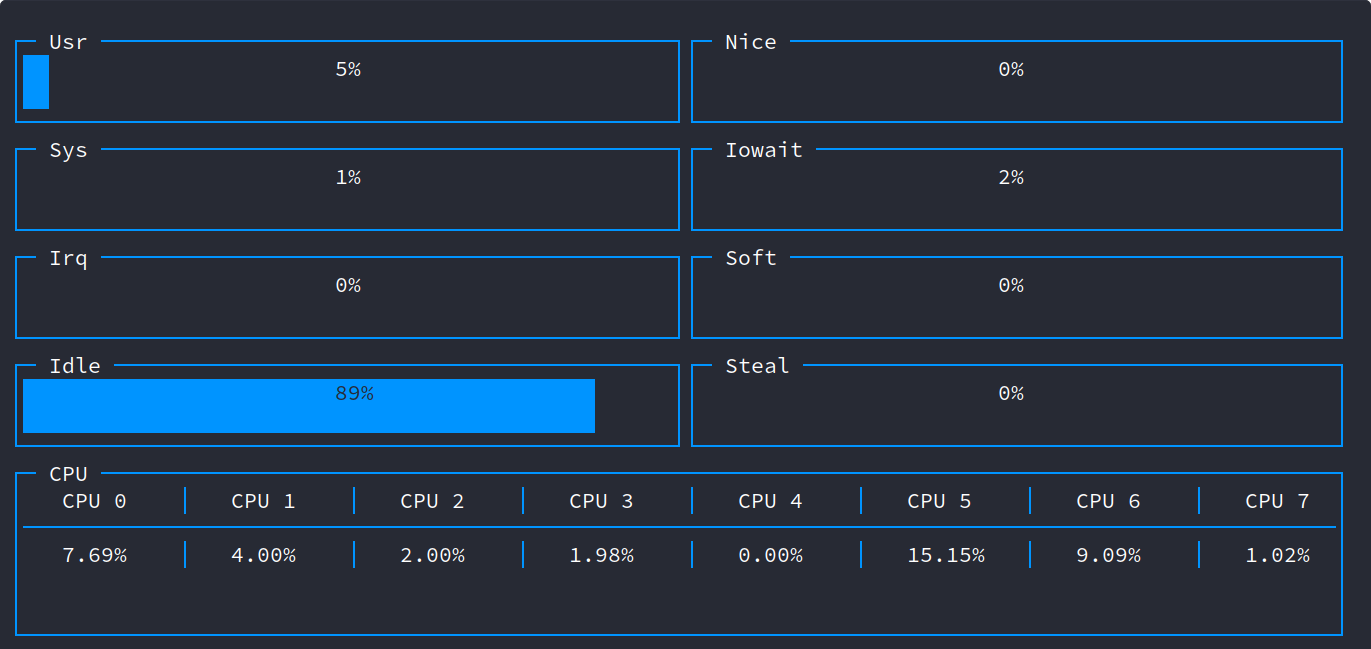
The -c, --cpuinfo flag displays finer details about the CPU load such as percentage of the time spent servicing software interrupts, hardware interrupts, etc.
Information provided:
- Usr : % of time spent executing user level applications.
- Sys : % of time spent executing kernel level processes.
- Irq : % of time spent servicing hardware interrupts.
- Idle : % of time CPU was idle.
- Nice : % of time spent by CPU executing user level processes with a nice priority.
- Iowait: % of time spent by CPU waiting for an outstanding disk I/O.
- Soft : % of time spent by the CPU servicing software interrupts.
- Steal : % of time spent in involuntary waiting by logical CPUs.
grofer proc [-p PID] [-r refreshRate]
If the -r flag is specified then the UI will refresh and display new information every refreshRate milliseconds. The minimum and default value for refreshRate is 1000 ms.
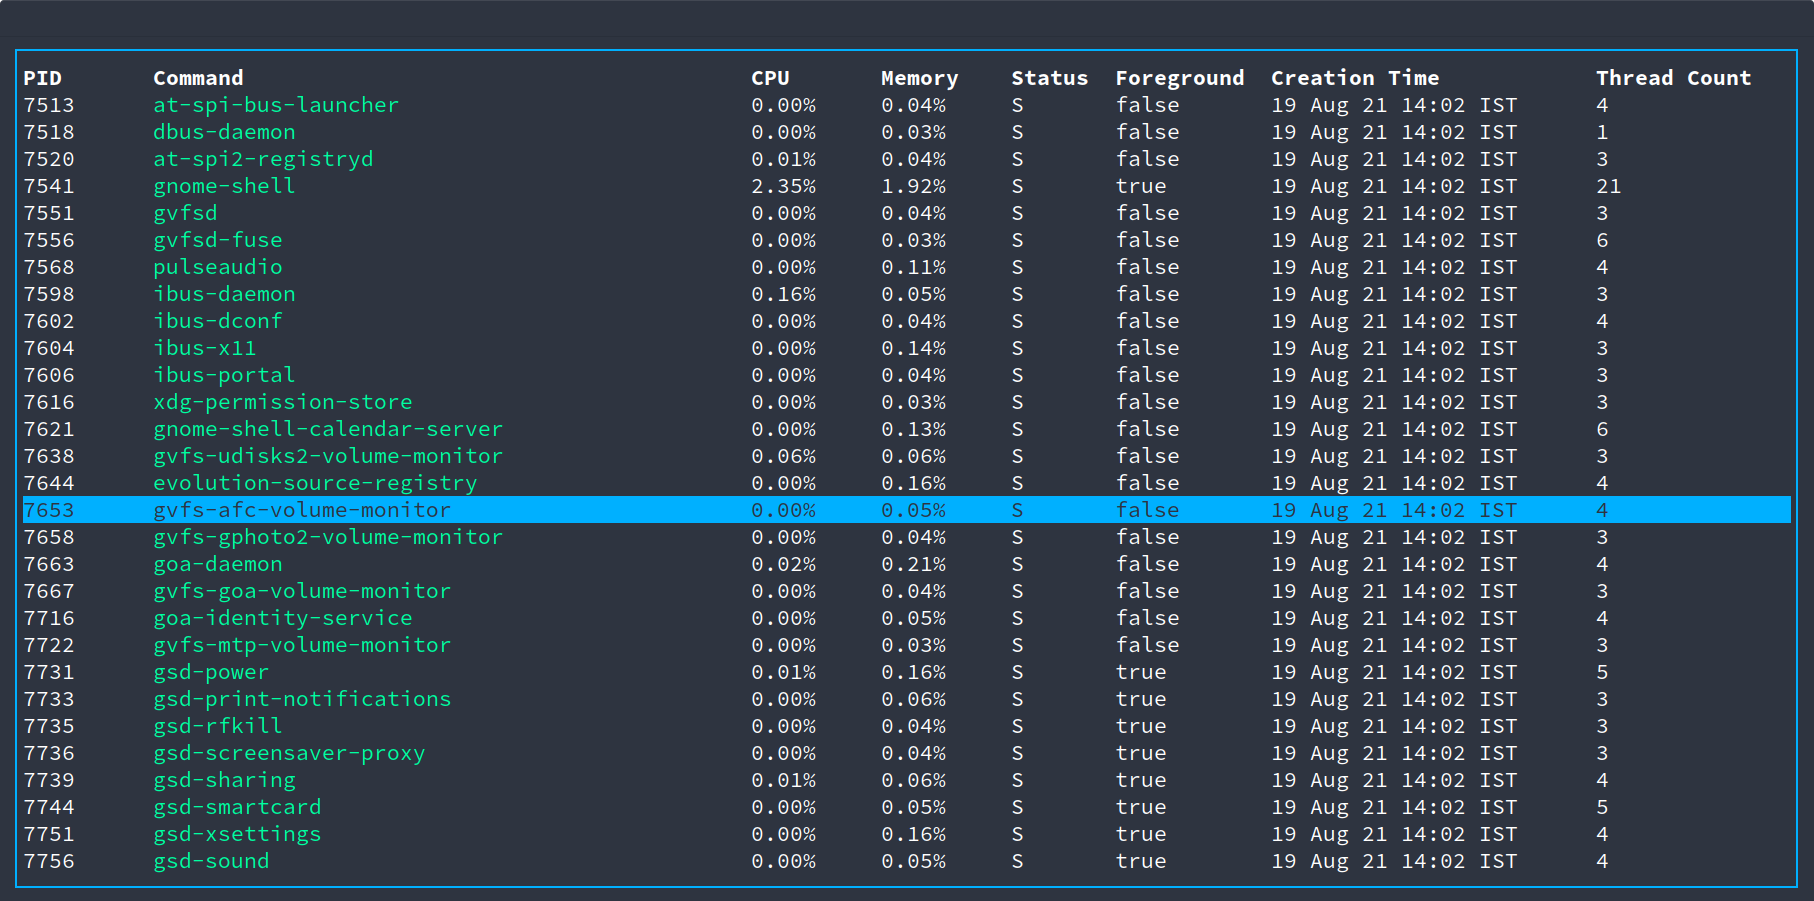
grofer proc
This lists all running processes and relevant information.
grofer proc -p PID
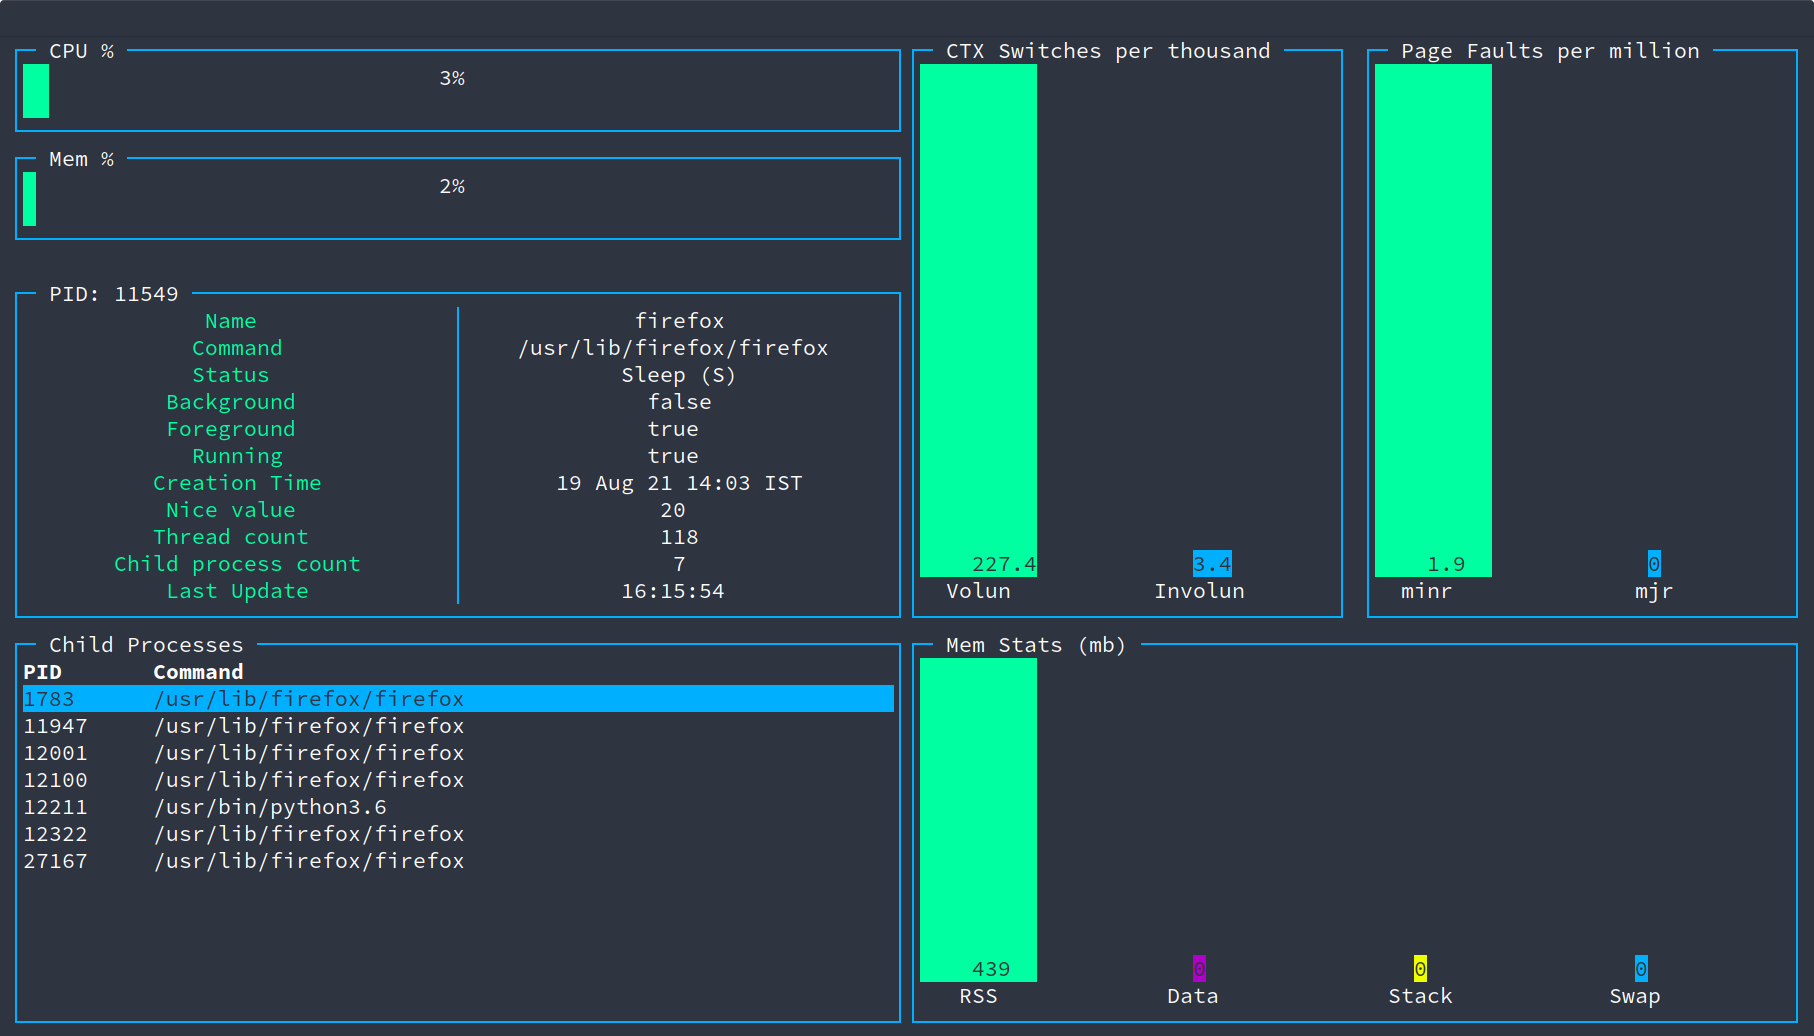
This gives information specific to a process, specified by a valid PID.
Passing a PID of 0 will list all the processes instead (same as grofer proc).
Information provided:
-
CPU utilization %
-
Memory utilization %
-
Child processes
-
Number of voluntary and involuntary context switches
-
Memory usage (RSS, Data, Stack, Swap)
grofer export [-i Iterations] [-f File] [-r refreshRate] [-t type] [-p PID]
This allows exporting of profiled data either of system usage or data particular to that of a process. Data format is JSON by default, but XML support exists too!
The flags are explained as follows:
-
-i, --iter: Number of iterations to profile for. -
-f, --filename: Name of output file (exported data). -
-r, --refresh: Refresh rate, time interval between iterations (in milliseconds). -
-t, --type: Specify the output data format (JSON by default). Types supported are:- JSON: Specifically, LJSON, where each line consists of one JSON object which contain nested fields and values.
-
-p, --pid: Specify PID of process to profile.


