riatelab / Linemap
♒️ Create maps made of lines
Stars: ✭ 96
Programming Languages
r
7636 projects
Projects that are alternatives of or similar to Linemap
Openrailwaymap
An OpenStreetMap-based project for creating a map of the world's railway infrastructure.
Stars: ✭ 150 (+56.25%)
Mutual labels: spatial, map
Agilework
可视化低代码快速开发平台,面向业务、企业管理系统定制开发平台和应用平台,包括设计器、应用端。提供业务配置和集成开发能力,用户通过可视化拖拉拽配置式操作即可快速构建出能同时在PC和移动端运行的各类管理系统,对于企业客户的信息系统在管理模式、业务流程、表单界面、数据可视化展示、IoT管控等个性化需求,可以通过设计器,快速的进行个性化配置。并支持企业微信,公众号,钉钉等移动集成,实现用户跨区域移动办公。从而构建企业个性化的行业应用、集成应用和复杂的业务报表。
Stars: ✭ 76 (-20.83%)
Mutual labels: map
Leaflet.labeltextcollision
Leaflet.LabelTextCollision is a LeafletJS plug-in to display labels on vector data while avoiding label collisions.
Stars: ✭ 65 (-32.29%)
Mutual labels: map
Imtools
Fast and memory-efficient immutable collections and helper data structures
Stars: ✭ 85 (-11.46%)
Mutual labels: map
Hms Mapkit Demo
HMS Map Kit demo provides an example of intergrating HMS Map Android SDK. Personalizing how your map displays and interacts with your users tailors their experience to them
Stars: ✭ 76 (-20.83%)
Mutual labels: map
Chinamapview
自定义View,可缩放、可平移、可点击的中国地图,有中国地图的全部省份,具备每个省份的点击接口
Stars: ✭ 1,250 (+1202.08%)
Mutual labels: map
Map
PHP Map package for easy and elegant handling of PHP arrays as array-like map objects
Stars: ✭ 1,180 (+1129.17%)
Mutual labels: map
Routegen
Define your API and SPA routes in one place. Use them anywhere. Only 1.3kb.
Stars: ✭ 86 (-10.42%)
Mutual labels: map
Instaloctrack
An Instagram OSINT tool to collect all the geotagged locations available on an Instagram profile in order to plot them on a map, and dump them in a JSON.
Stars: ✭ 85 (-11.46%)
Mutual labels: map
Dyno
Package dyno is a utility to work with dynamic objects at ease.
Stars: ✭ 81 (-15.62%)
Mutual labels: map
![]()
![]()
linemap: Create Maps Made of Lines
Example
The package contains two functions: linemap() and getgrid()
linemap()
linemap() displays a map made of lines using a data frame of gridded data.
library(linemap)
library(sf)
data("popOcc")
data("occitanie")
opar <- par(mar=c(0,0,0,0), bg = "ivory2")
plot(st_geometry(occitanie), col="ivory1", border = NA)
linemap(x = popOcc, var = "pop", k = 2.5, threshold = 50,
        col = "ivory1", border = "ivory4", lwd = 0.6, add = TRUE)
par(opar)

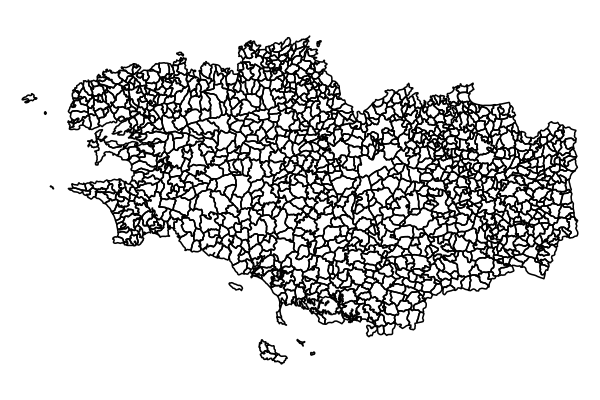
getgrid()
getgrid() transforms a set of polygons (sf objects) into a suitable data frame for linemap().
library(linemap)
library(sf)
data("bretagne")
data("france")
plot(st_geometry(bretagne))
bret <- getgrid(x = bretagne, cellsize = 2000, var = "POPULATION")
bret[6010:6014,]
| X | Y | POPULATION | |
|---|---|---|---|
| 6010 | 340217.1 | 6783195 | 670.7509 |
| 6011 | 342217.1 | 6783195 | 1050.2651 |
| 6012 | 344217.1 | 6783195 | 1410.0992 |
| 6013 | 346217.1 | 6783195 | 2304.2012 |
| 6014 | 348217.1 | 6783195 | 2875.4047 |
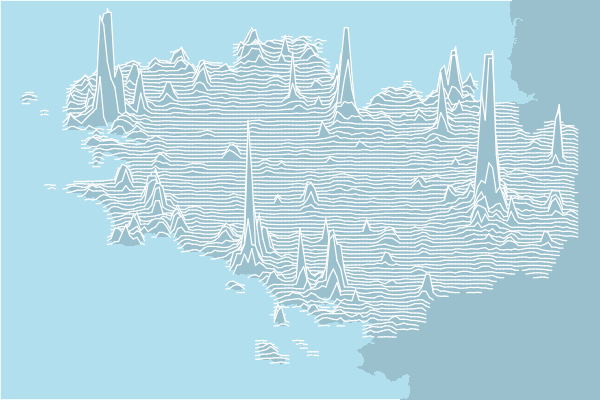
opar <- par(mar = c(0,0,0,0))
plot(st_geometry(france), col="lightblue3", border = NA, bg = "lightblue2",
     xlim = c(min(bret$X), max(bret$X)), ylim= c(min(bret$Y), max(bret$Y)))
linemap(x = bret, var = "POPULATION", k = 5, threshold = 1,
        col = "lightblue3", border = "white", lwd = 0.8,
        add = TRUE)
par(opar)
Blogposts
linemap (rgeomatic)
Graphiques linéaires géospatiaux (MTMX):

Installation
Stable
install.packages('linemap')
Dev
library(devtools)
install_github("riatelab/linemap")
Inspiration
Unknown Pleasures (Joy Division)
Population Lines: How and Why I Created It (James Cheshire)
GeospatialLineGraphs (Ryan Brideau)
Alternative
- ggplot2 + ggridges
Note that the project description data, including the texts, logos, images, and/or trademarks,
for each open source project belongs to its rightful owner.
If you wish to add or remove any projects, please contact us at [email protected].