All Projects → SymbolixAU → Mapdeck

SymbolixAU / Mapdeck

R interface to Deck.gl and Mapbox

Programming Languages

r
7636 projects

Projects that are alternatives of or similar to Mapdeck

Editor
An open source visual editor for the 'Mapbox Style Specification'
Stars: ✭ 1,167 (+294.26%)
Mutual labels:  geospatial, mapbox-gl, mapbox-gl-js, maps
Road Orientation Map
A visualization of road orientations on an interactive map
Stars: ✭ 254 (-14.19%)
Mutual labels:  geospatial, mapbox, mapbox-gl-js, maps
deck.gl-time-series-widget
A React Time Slider implementation for DECK.GL - (non)temporal data - by CPU filtering ⌛
Stars: ✭ 19 (-93.58%)
Mutual labels:  mapbox-gl, maps, mapbox-gl-js, mapbox
angular-mapboxgl-directive
AngularJS directive for Mapbox GL
Stars: ✭ 43 (-85.47%)
Mutual labels:  mapbox-gl, maps, mapbox-gl-js, mapbox
react-mapboxgl
Declarative React components for mapbox-gl-js.
Stars: ✭ 15 (-94.93%)
Mutual labels:  mapbox-gl, mapbox-gl-js, mapbox
Mapbox Gl Native
Interactive, thoroughly customizable maps in native Android, iOS, macOS, Node.js, and Qt applications, powered by vector tiles and OpenGL
Stars: ✭ 4,091 (+1282.09%)
Mutual labels:  mapbox, mapbox-gl, maps
Mappa
A canvas wrapper for Maps 🗺 🌍
Stars: ✭ 290 (-2.03%)
Mutual labels:  mapbox, mapbox-gl, maps
Martin
Blazing fast and lightweight PostGIS vector tiles server
Stars: ✭ 540 (+82.43%)
Mutual labels:  mapbox, mapbox-gl, mapbox-gl-js
react-map-gl-cluster
Urbica React Cluster Component for Mapbox GL JS
Stars: ✭ 27 (-90.88%)
Mutual labels:  mapbox-gl, maps, mapbox-gl-js
Osm Liberty
A free Mapbox GL basemap style for everyone
Stars: ✭ 231 (-21.96%)
Mutual labels:  mapbox-gl, mapbox-gl-js, maps
Mapbox Gl Js
Interactive, thoroughly customizable maps in the browser, powered by vector tiles and WebGL
Stars: ✭ 8,017 (+2608.45%)
Mutual labels:  mapbox, mapbox-gl, mapbox-gl-js
Mapbox Gl Native Android
Interactive, thoroughly customizable maps in native Android powered by vector tiles and OpenGL
Stars: ✭ 135 (-54.39%)
Mutual labels:  mapbox, mapbox-gl, maps
maptalks.mapboxgl
MapboxglLayer for maptalks.js
Stars: ✭ 51 (-82.77%)
Mutual labels:  mapbox-gl, mapbox-gl-js, mapbox
vue-mapbox-map
A minimalist Vue component wrapping Mapbox GL or MapLibre GL for dynamic interaction!
Stars: ✭ 26 (-91.22%)
Mutual labels:  maps, mapbox-gl-js, mapbox
jsfiddle-github
JSFiddle implementation for interactive JavaScript examples.
Stars: ✭ 16 (-94.59%)
Mutual labels:  maps, geospatial
elm-mapbox
MapboxGL bindings for Elm
Stars: ✭ 55 (-81.42%)
Mutual labels:  mapbox-gl, maps
jpn-atlas
TopoJSONフォーマットの日本の国、都道府県、市区町村の境界データ。Japanese municipality and prefecture boundary data in topojson format.
Stars: ✭ 17 (-94.26%)
Mutual labels:  maps, geospatial
web-maps-wcag-evaluation
Manual accessibility evaluation of popular web map tools.
Stars: ✭ 28 (-90.54%)
Mutual labels:  mapbox-gl-js, mapbox
rafagas
Daily geospatial links curated by Raf Roset
Stars: ✭ 17 (-94.26%)
Mutual labels:  maps, geospatial
Osmnx
OSMnx: Python for street networks. Retrieve, model, analyze, and visualize street networks and other spatial data from OpenStreetMap.
Stars: ✭ 3,357 (+1034.12%)
Mutual labels:  geospatial, maps

mapdeck

R build status Codecov test coverage CRAN_Status_Badge downloads CRAN RStudio mirror downloads Github Stars

What is mapdeck?

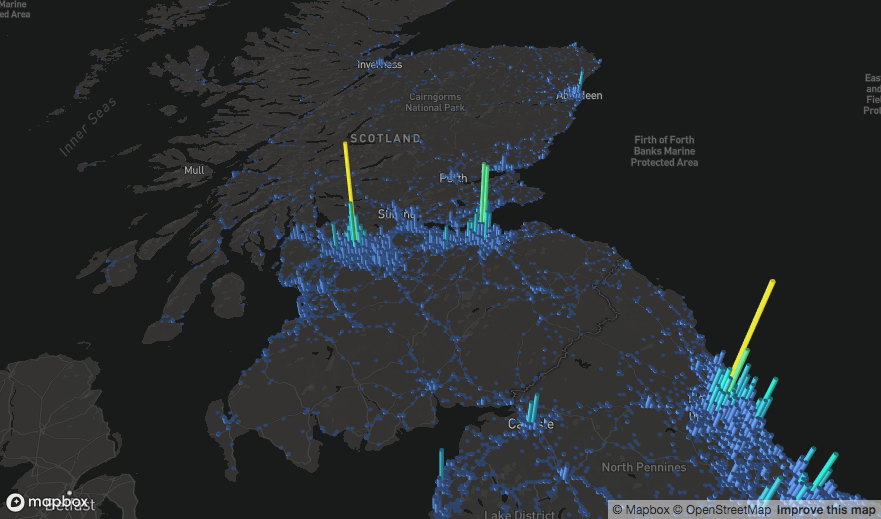
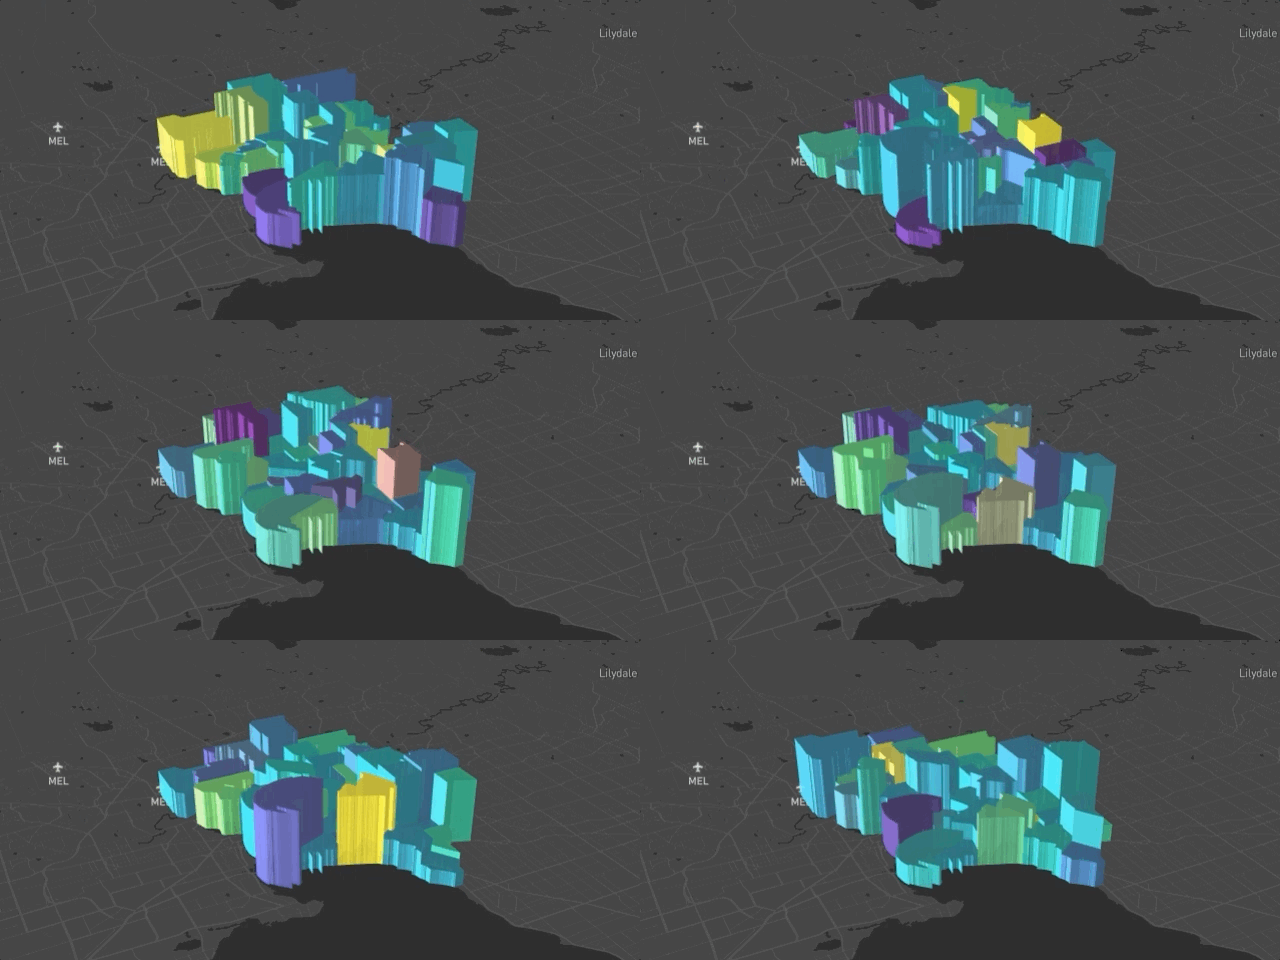
An R library which lets you plot large data sets (as much as your GPU & browser can handle), on interactive maps using Mapbox GL and Deck.gl

What is mapbox?

Mapbox is the location data platform for mobile and web applications. We provide building blocks to add location features like maps, search, and navigation into any experience you create.

What is deck.gl?

deck.gl is a WebGL-powered framework for visual exploratory data analysis of large datasets.

How do I use it?

First you need to install it, either from CRAN

install.packages("mapdeck")

Or from github (to get the latest development version)

devtools::install_github("SymbolixAU/mapdeck")

Then everything you need to know to get you started is on the home page

Quick Start

Mapdeck uses Mapbox maps, and to use Mapbox you need an access token.

Once you’ve generate a token you can use their maps.

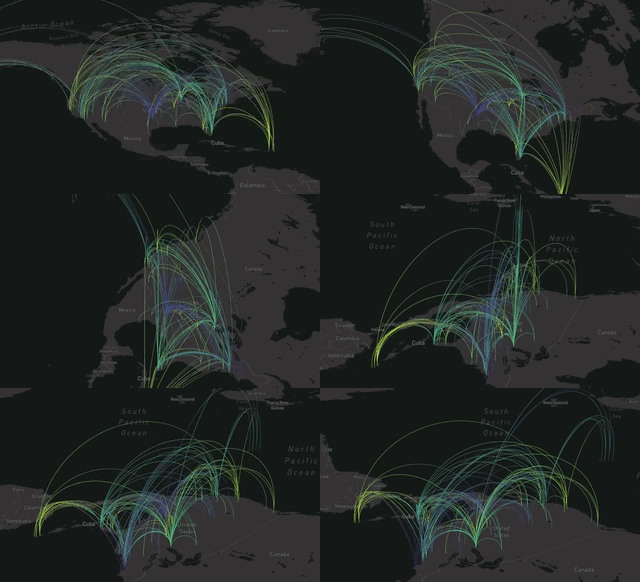
Call mapdeck(token = 'your_token') to generate a basic map. Then start adding layers by using one of the various add_*() functions.

url <- 'https://raw.githubusercontent.com/plotly/datasets/master/2011_february_aa_flight_paths.csv'
flights <- read.csv(url)
flights$info <- paste0("<b>",flights$airport1, " - ", flights$airport2, "</b>")

mapdeck(token = key, style = mapdeck_style('dark')) %>%
  add_arc(
    data = flights
    , origin = c("start_lon", "start_lat")
    , destination = c("end_lon", "end_lat")
    , stroke_from = "airport1"
    , stroke_to = "airport2"
    , tooltip = "info"
    , layer_id = 'arclayer'
  )

Arcs

See the Layers page for more examples

Getting help

For general help and advice the best place to ask is on StackOverflow (using the mapdeck tag).

If you’ve found a bug, or want a new feature added then use the issue tracker on github.

I don’t respond to emails asking for help because this is an open source package, and any advice should be kept open so everyone can benefit. (unless you want to pay me!)

Note that the project description data, including the texts, logos, images, and/or trademarks, for each open source project belongs to its rightful owner. If you wish to add or remove any projects, please contact us at [email protected].