TetsuakiBaba / Ofxgraph
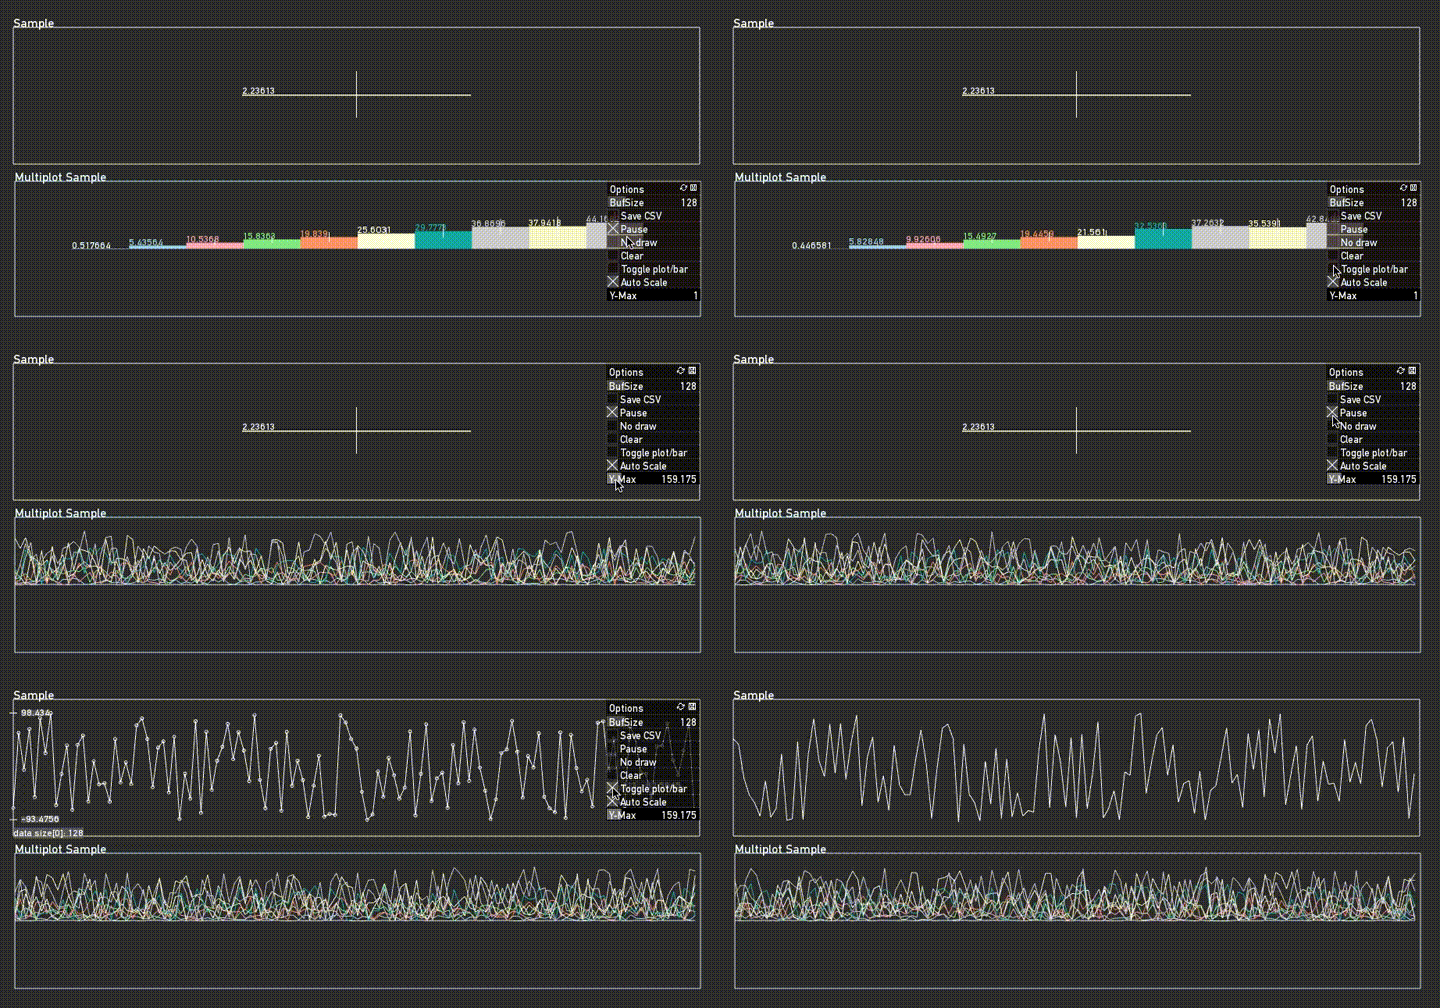
ofxGraph is a simple, easy and quick graph add-on for openframeworks.
Stars: ✭ 23
Labels
Projects that are alternatives of or similar to Ofxgraph
ofxHistoryPlot
Visualize value history on a configurable graph
Stars: ✭ 40 (+73.91%)
Mutual labels: openframeworks, plot
Ofxgrafica
A simple and configurable plotting library for openFrameworks
Stars: ✭ 24 (+4.35%)
Mutual labels: openframeworks, plot
Adjusttext
A small library for automatically adjustment of text position in matplotlib plots to minimize overlaps.
Stars: ✭ 731 (+3078.26%)
Mutual labels: plot
Ttyplot
a realtime plotting utility for terminal/console with data input from stdin
Stars: ✭ 532 (+2213.04%)
Mutual labels: plot
Chatistics
💬 Python scripts to parse Messenger, Hangouts, WhatsApp and Telegram chat logs into DataFrames.
Stars: ✭ 814 (+3439.13%)
Mutual labels: plot
Function Plot
A 2d function plotter powered by d3 and interval arithmetic
Stars: ✭ 625 (+2617.39%)
Mutual labels: plot
Ofxdatgui
Simple to use, fully customizable, high-resolution graphical user interface for openFrameworks
Stars: ✭ 395 (+1617.39%)
Mutual labels: openframeworks
Vega Lite
A concise grammar of interactive graphics, built on Vega.
Stars: ✭ 3,568 (+15413.04%)
Mutual labels: plot
Gramm
Gramm is a complete data visualization toolbox for Matlab. It provides an easy to use and high-level interface to produce publication-quality plots of complex data with varied statistical visualizations. Gramm is inspired by R's ggplot2 library.
Stars: ✭ 541 (+2252.17%)
Mutual labels: plot
Footfall
Application that allows you to monitor the traffic in and out of your building, using the RPi Camera and openFrameworks
Stars: ✭ 301 (+1208.7%)
Mutual labels: openframeworks
Uplot
📈 A small, fast chart for time series, lines, areas, ohlc & bars
Stars: ✭ 6,808 (+29500%)
Mutual labels: plot
Gochart
A chart plotting tool implemented by Golang and Highcharts.
Stars: ✭ 293 (+1173.91%)
Mutual labels: plot
Aachartcore Kotlin
📈📊⛰⛰⛰An elegant modern declarative data visualization chart framework for Android . Extremely powerful, supports line, spline, area, areaspline, column, bar, pie, scatter, angular gauges, arearange, areasplinerange, columnrange, bubble, box plot, error bars, funnel, waterfall and polar chart types.极其精美而又强大的 Android 数据可视化图表框架,支持柱状图、条形图、折线图、曲线图、折线填充图、曲线填充图、气泡图、扇形图、环形图、散点图、雷达图、混合图等各种类型的多达几十种的信息图图表,完全满足工作所需.
Stars: ✭ 332 (+1343.48%)
Mutual labels: plot
Lets Plot
An open-source plotting library for statistical data.
Stars: ✭ 531 (+2208.7%)
Mutual labels: plot
Pyflo
PyFlo is an open-source library written in Python for performing hydraulic and hydrology stormwater analysis. Features include network hydraulic grade analysis and time/iteration based storage and flood routing simulations.
Stars: ✭ 19 (-17.39%)
Mutual labels: plot
ofxGraph: a simple plotter for openframeworks
Description
ofxGraph is a graph plotting addon for openframeworks.
- single/multiple plot
- Manual adjustable graph size and position
- detailed plot data information
- Adjustable buffer size
- CSV file export with a save dialog
- Automatic saving(position and size). except for ofxGui settings.
- New: Added Bar Graph Mode. you can change graph mode to bar or plot.
Usage
- Copy ofxGraph/Example/bin/data/ofxGraph directory to your_OF_project_directory/bin/data
- Below is a minimal code to use ofxGraph.
void ofApp::setup(){

// ofxGraph Init
  graph.setup("sample");
  graph.setDx(1.0); // which means delta of time
  graph.setColor(ofColor::white);  // ofColor(255,255,255)
}
void ofApp::update(){
  // plot a random data on a each frame
  graph.add(ofRandom(-100,100));
}

void ofApp::draw(){
  ofBackground(50,50,50);
  graph.draw();
}
See Example for more detailed.
Install
ofxGui and ofxXmlSettings are required.
Licence
Author
Note that the project description data, including the texts, logos, images, and/or trademarks,
for each open source project belongs to its rightful owner.
If you wish to add or remove any projects, please contact us at [email protected].


