benjiyamin / Pyflo
Programming Languages
Labels
Projects that are alternatives of or similar to Pyflo
Project Overview
PyFlo is an open-source library written in Python for performing hydraulic and hydrology stormwater analysis. Capabilities include network hydraulic grade analysis and time/iteration based storage and flood routing simulations. SCS Unit Hydrograph and Rational Method are included for basin computations. Most of the calculations and procedures are derived from available existing publications and resources. There are some GUI programs available that have similar capabilities. The intent is that many will build from and contribute to the project, making it much more powerful than a single person ever could.
Installation
Installing the easy way, using pip:
$ pip install pyflo
Examples
Hydrographs
From NEH Hydrology Ch. 16, Ex. 16-1:
from pyflo import system
from pyflo.nrcs import hydrology

uh484 = system.array_from_csv('./resources/distributions/runoff/scs484.csv')
basin = hydrology.Basin(
    area=4.6,
    cn=85.0,
    tc=2.3,
    runoff_dist=uh484,
    peak_factor=484.0
)
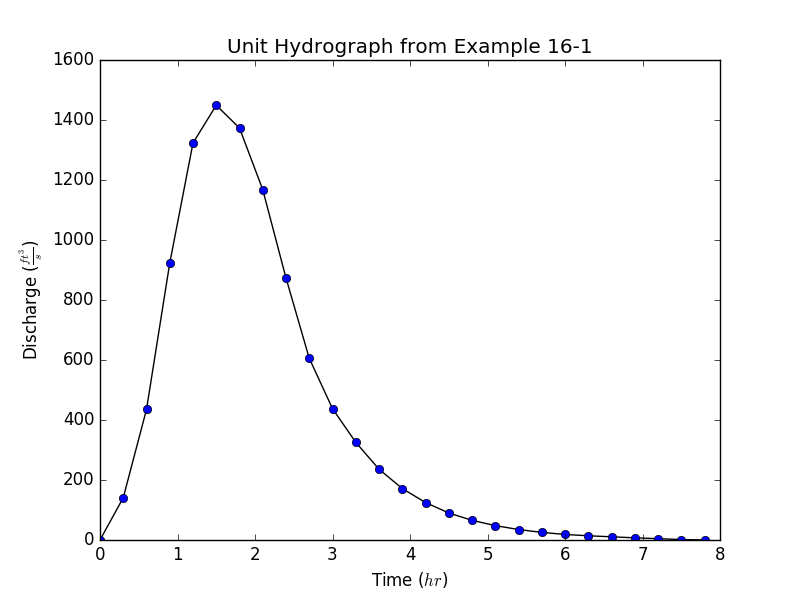
Unit Hydrograph
With PyFlo, it's fairly simple to create a unit hydrograph, which represents the time-flow relationship per unit (inch) of runoff depth.
unit_hydrograph = basin.unit_hydrograph(interval=0.3)
We can use matplotlib to plot the example results:
from matplotlib import pyplot

x = unit_hydrograph[:, 0]
y = unit_hydrograph[:, 1]
pyplot.plot(x, y, 'k')
pyplot.plot(x, y, 'bo')
pyplot.title(r'Unit Hydrograph from Example 16-1')
pyplot.xlabel(r'Time ($hr$)')
pyplot.ylabel(r'Discharge ($\frac{ft^{3}}{s}$)')
pyplot.show()
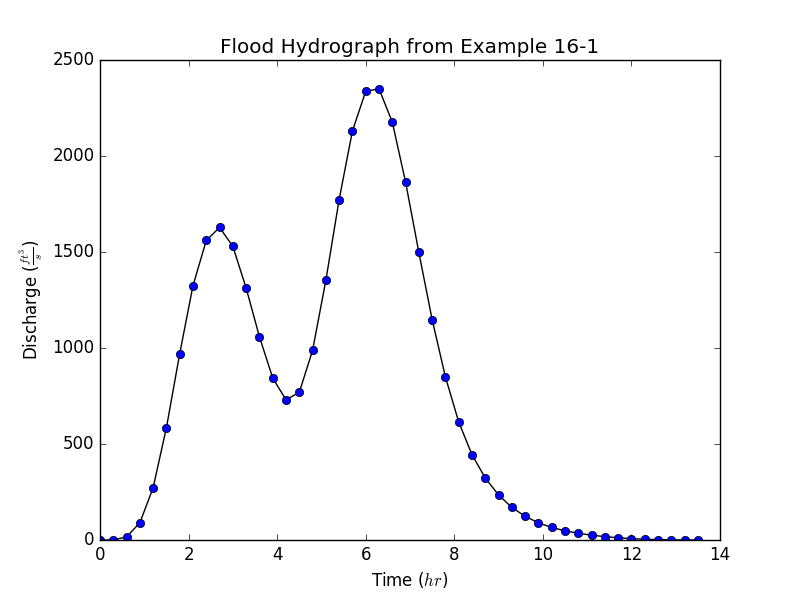
Flood Hydrograph
A flood hydrograph can be generated, which is a time-flow relationship synthesized from basin properties and a provided scaled rainfall distribution.
import numpy

rainfall_dist = numpy.array([
    (0.00, 0.000),
    (0.05, 0.074),
    (0.10, 0.174),
    (0.15, 0.280),
    (0.20, 0.378),
    (0.25, 0.448),
    (0.30, 0.496),
    (0.35, 0.526),
    (0.40, 0.540),
    (0.45, 0.540),
    (0.50, 0.540),
    (0.55, 0.542),
    (0.60, 0.554),
    (0.65, 0.582),
    (0.70, 0.640),
    (0.75, 0.724),
    (0.80, 0.816),
    (0.85, 0.886),
    (0.90, 0.940),
    (0.95, 0.980),
    (1.00, 1.000)
])
rainfall_depths = rainfall_dist * [6.0, 5.0]  # Scale array to 5 inches over 6 hours.
flood_hydrograph = basin.flood_hydrograph(rainfall_depths, interval=0.3)
We can use matplotlib to plot the example results:
from matplotlib import pyplot

x = flood_hydrograph[:, 0]
y = flood_hydrograph[:, 1]
pyplot.plot(x, y, 'k')
pyplot.plot(x, y, 'bo')
pyplot.title(r'Flood Hydrograph from Example 16-1')
pyplot.xlabel(r'Time ($hr$)')
pyplot.ylabel(r'Discharge ($\frac{ft^{3}}{s}$)')
pyplot.show()
Contributing
For developers, it's important to use common best practices when contributing to the project. PEP 8 should always be adhered. Code should be documented with Google style docstrings. Pull requests and filing issues are encouraged.
To start contributing with the PyFlo repository:
-
Fork it!
-
Create a local clone of your fork.
$ git clone https://github.com/YOUR-USERNAME/pyflo Cloning into `pyflo`... remote: Counting objects: 10, done. remote: Compressing objects: 100% (8/8), done. remove: Total 10 (delta 1), reused 10 (delta 1) Unpacking objects: 100% (10/10), done. -
Set up a clean working environment, using virtualenv.
$ virtualenv -p python3 venv $ source venv/bin/activate $ pip install -r requirements/development.txt -
Add the original as a remote repository named
upstream.$ git remote add upstream https://github.com/benjiyamin/pyflo.git $ git remote -v origin https://github.com/YOUR-USERNAME/pyflo.git (fetch) origin https://github.com/YOUR-USERNAME/pyflo.git (push) upstream https://github.com/benjiyamin/pyflo.git (fetch) upstream https://github.com/benjiyamin/pyflo.git (push) -
Fetch the current upstream repository branches and commits.
$ git fetch upstream remote: Counting objects: 75, done. remote: Compressing objects: 100% (53/53), done. remote: Total 62 (delta 27), reused 44 (delta 9) Unpacking objects: 100% (62/62), done. From https://github.com/benjiyamin/pyflo * [new branch] master -> upstream/master -
Checkout your local
masterbranch and syncupstream/masterto it, without losing local changes.$ git checkout master Switched to branch 'master' $ git merge upstream/master -
Commit your local changes and push to
upstream/master.$ git commit -m 'Add some feature' $ git push upstream master -
Submit a pull request. =)
For a list of contributors who have participated in this project, check out AUTHORS.
Testing
Unit Testing is currently done using the built-in unittest module:
$ python tests.py
License
This project is licensed under GPL 3.0 - see LICENSE for details.


