All Projects → njanakiev → Openstreetmap Heatmap

njanakiev / Openstreetmap Heatmap

Licence: apache-2.0
Visualization of OpenStreetMap Data with Blender and Python

Programming Languages

python
139335 projects - #7 most used programming language

Projects that are alternatives of or similar to Openstreetmap Heatmap

Leaflet Swoopy
⤵️ Swoopy Arrow Plugin for Leaflet
Stars: ✭ 52 (-80.08%)
Mutual labels:  data-visualization, dataviz
Awesome Dataviz
📈 A curated list of awesome data visualization libraries and resources.
Stars: ✭ 2,905 (+1013.03%)
Mutual labels:  data-visualization, dataviz
Reaviz
📊 Data visualization library for React based on D3
Stars: ✭ 1,141 (+337.16%)
Mutual labels:  data-visualization, dataviz
Leaflet Dvf
Leaflet Data Visualization Framework
Stars: ✭ 678 (+159.77%)
Mutual labels:  data-visualization, dataviz
Datav
📊https://datav.io is a modern APM, provide observability for your business, application and infrastructure. It's also a lightweight alternative to Grafana.
Stars: ✭ 2,757 (+956.32%)
Mutual labels:  data-visualization, dataviz
Explorer
Data Explorer by Keen - point-and-click interface for analyzing and visualizing event data.
Stars: ✭ 725 (+177.78%)
Mutual labels:  data-visualization, dataviz
Dex
Dex : The Data Explorer -- A data visualization tool written in Java/Groovy/JavaFX capable of powerful ETL and publishing web visualizations.
Stars: ✭ 1,238 (+374.33%)
Mutual labels:  data-visualization, dataviz
Ggpage
Creates Page Layout Visualizations in R 📄📄📄
Stars: ✭ 306 (+17.24%)
Mutual labels:  data-visualization, dataviz
Matplotlib Cheatsheet
Matplotlib 3.1 cheat sheet.
Stars: ✭ 2,806 (+975.1%)
Mutual labels:  data-visualization, dataviz
Keen Dataviz.js
Data Visualization Charting Library
Stars: ✭ 215 (-17.62%)
Mutual labels:  data-visualization, dataviz
Heatmap.js
🔥 JavaScript Library for HTML5 canvas based heatmaps
Stars: ✭ 5,685 (+2078.16%)
Mutual labels:  data-visualization, dataviz
Blender Osm
One click download and import of OpenStreetMap and terrain for Blender! Global coverage! Source code is in the branch 'release'.
Stars: ✭ 588 (+125.29%)
Mutual labels:  blender, openstreetmap
Keen Js
https://keen.io/ JavaScript SDKs. Track users and visualise the results. Demo http://keen.github.io/keen-dataviz.js/
Stars: ✭ 588 (+125.29%)
Mutual labels:  data-visualization, dataviz
Amcharts4
The most advanced amCharts charting library for JavaScript and TypeScript apps.
Stars: ✭ 907 (+247.51%)
Mutual labels:  data-visualization, dataviz
React Jsx Highcharts
Highcharts built with proper React components
Stars: ✭ 336 (+28.74%)
Mutual labels:  data-visualization, dataviz
React Fusioncharts Component
ReactJS component for FusionCharts JavaScript Charting library.
Stars: ✭ 73 (-72.03%)
Mutual labels:  data-visualization, dataviz
Data2viz
An Android, JavaFx, JS multiplatform datavisualization library with comprehensive DSL
Stars: ✭ 300 (+14.94%)
Mutual labels:  data-visualization, dataviz
Slopegraph
Edward Tufte-Inspired Slopegraphs
Stars: ✭ 166 (-36.4%)
Mutual labels:  data-visualization, dataviz
Blendergis
Blender addons to make the bridge between Blender and geographic data
Stars: ✭ 4,642 (+1678.54%)
Mutual labels:  blender, openstreetmap
3D-Public-Transport-Simulator
The 3D Public Transport Simulator is a Unity-based simulation, which uses OpenStreetMap data in order to support the simulation of worldwide locations. The development was part of a Bachelor thesis.
Stars: ✭ 87 (-66.67%)
Mutual labels:  blender, openstreetmap

Openstreetmap Heatmap

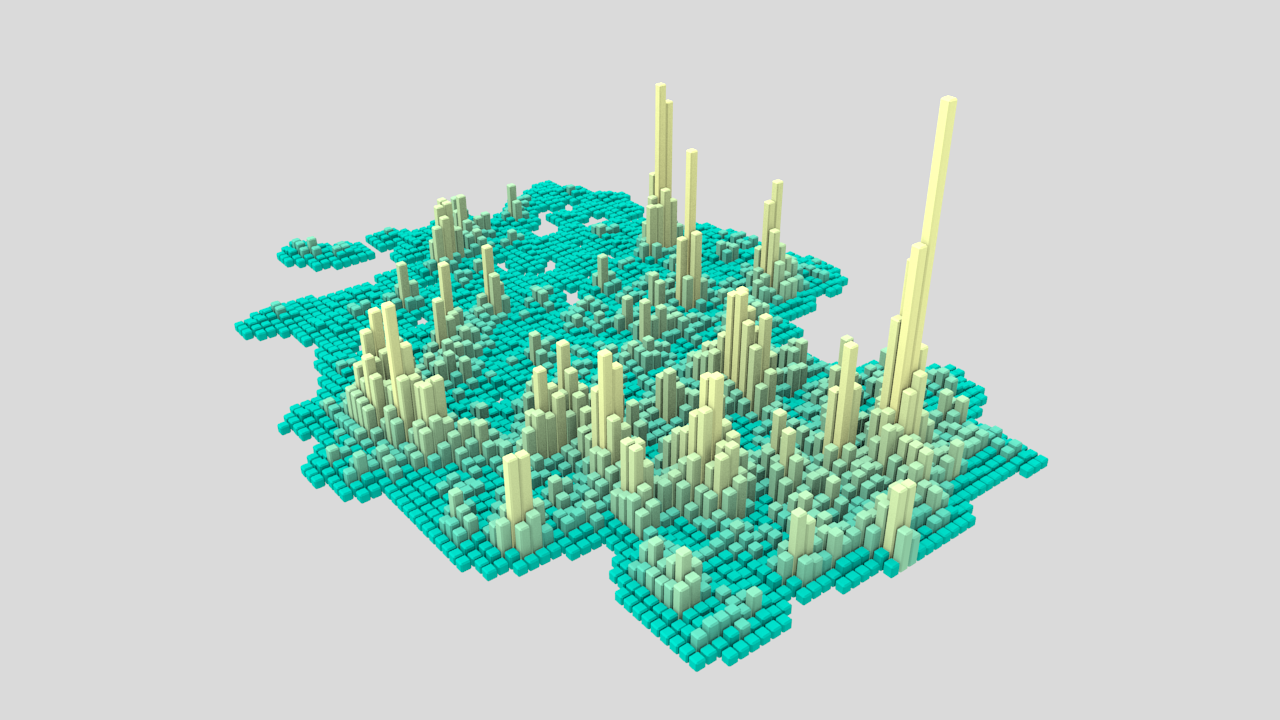
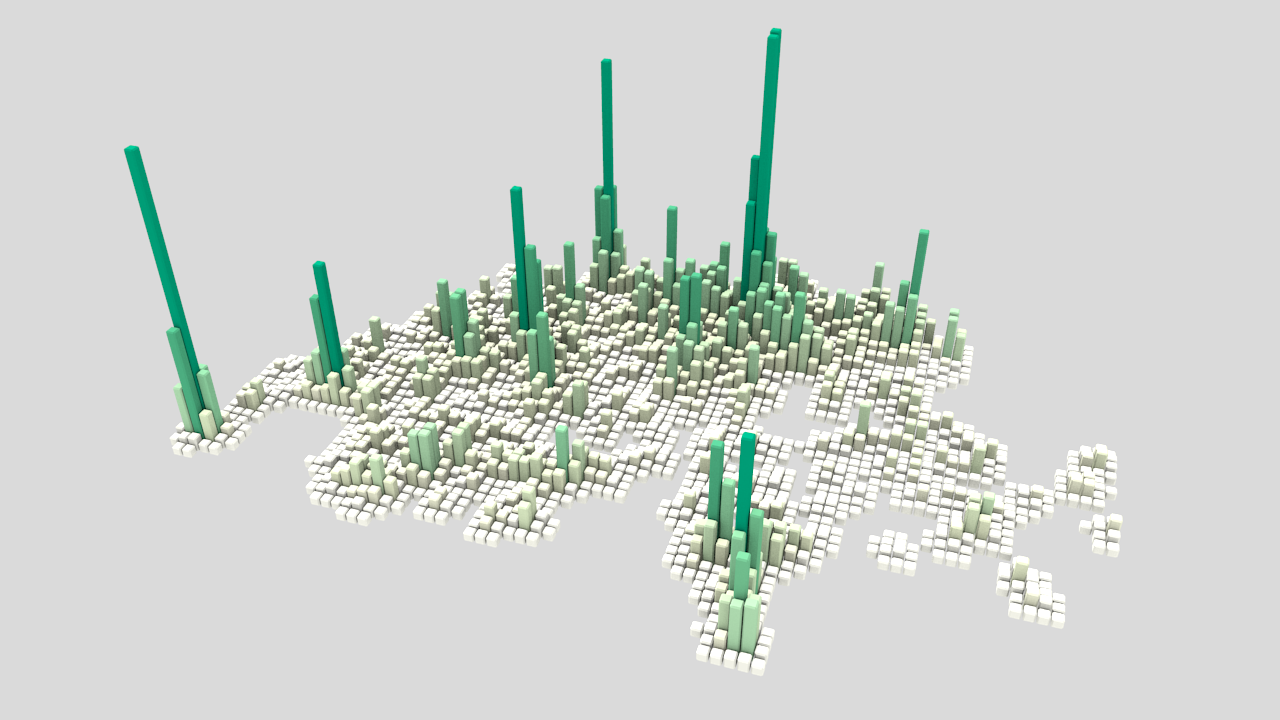
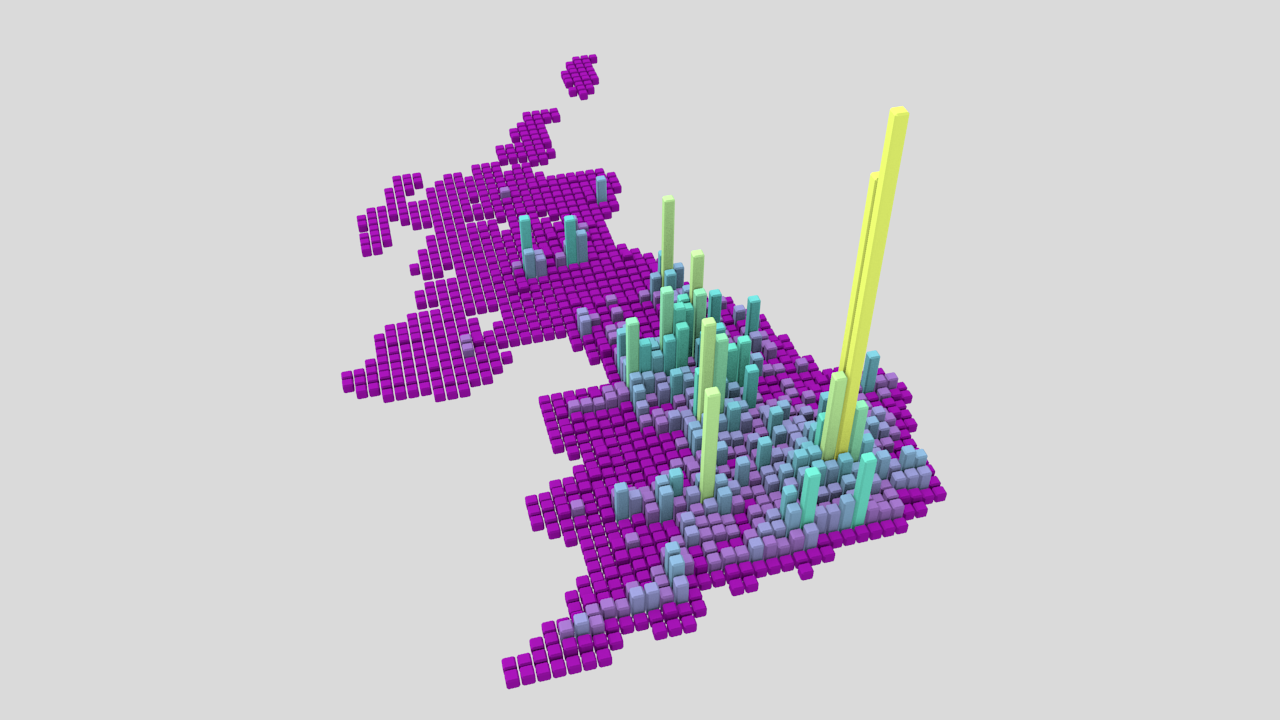
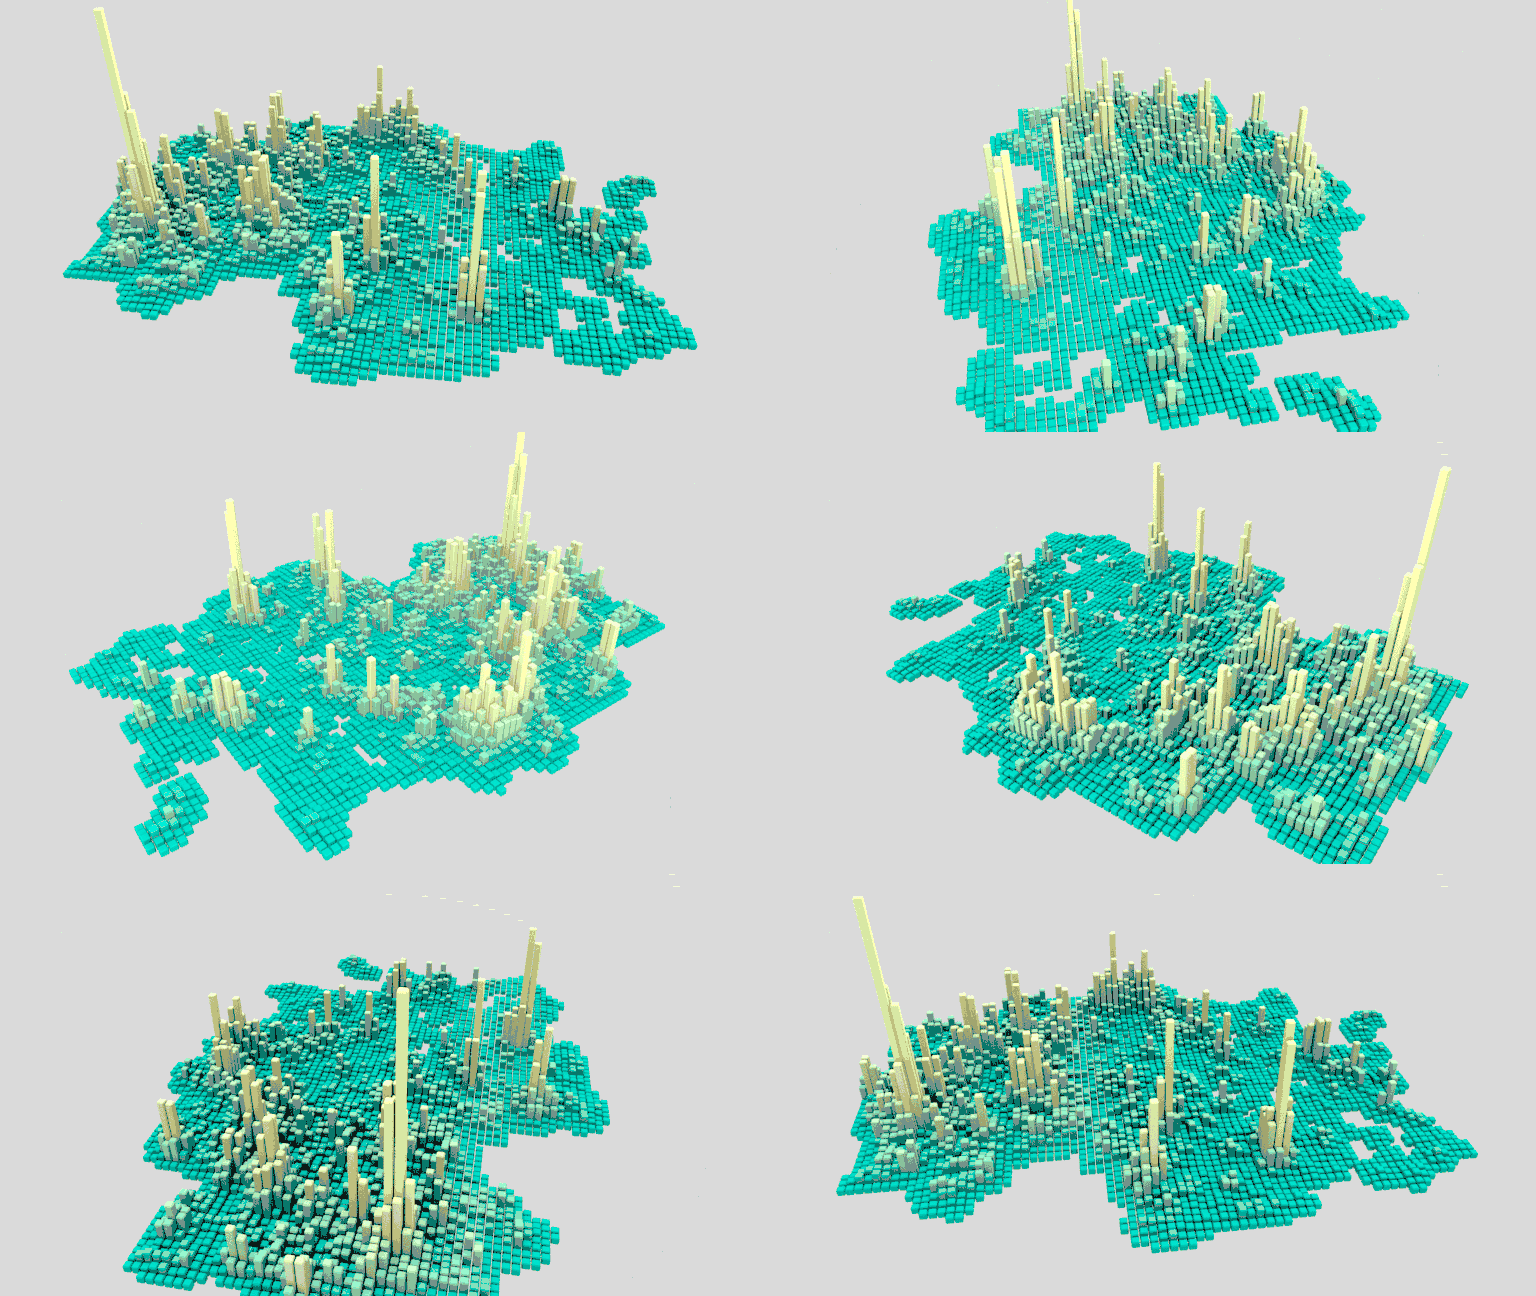
This project is a visualization of OpenStreetMap data with Blender and Python as a 3D barplot. It creates an occurence heatmap of all points that are collected within a country with a certain tag.

OpenStreetMap (OSM) has a vast geospatial data set containing various tags and attributes besides the geometry. By using the Overpass API we can query for specific tags, filter specific areas and various other kinds of queries. In this case we want to query for tags within the boundary of a country. We are using the two-letter country codes and filter for a single OSM tag across all available OSM elements. You can see the various Map Features to get a grasp of the variety.

DE_biergarten_animation

Requirements

In order to run this script you need to run

blender -b -P run_script.py

which runs the rendering in the background. You can also load run_script.py into Blender as a script and execute the program from there. You need to have the overpy package available in your Python distribution which is accessed by Blender. I described in this article how to use Anaconda in Blender, which is handy for installing and using additional python packages.

You can edit the settings within the render_osm_data.py under the # Settings part. The script can do both render frames of an animation (rotation around the barplot) or render a single frame. You can also load and save the points as a GeoJSON with the utils_osm.py script.

Gallery

All Biergarten in Germany

DE_biergarten

All Swiss Banks

CH_bank

All Pubs in Great Britain

GB_pub

Note that the project description data, including the texts, logos, images, and/or trademarks, for each open source project belongs to its rightful owner. If you wish to add or remove any projects, please contact us at [email protected].