raphaellepuschitz / Svg World Map
Programming Languages
Labels
Projects that are alternatives of or similar to Svg World Map
SVG World Map JS
🗺 A JavaScript library to easily integrate one or more SVG world maps with all nations (countries) and second-level political subdivisions (countries, provinces, states).
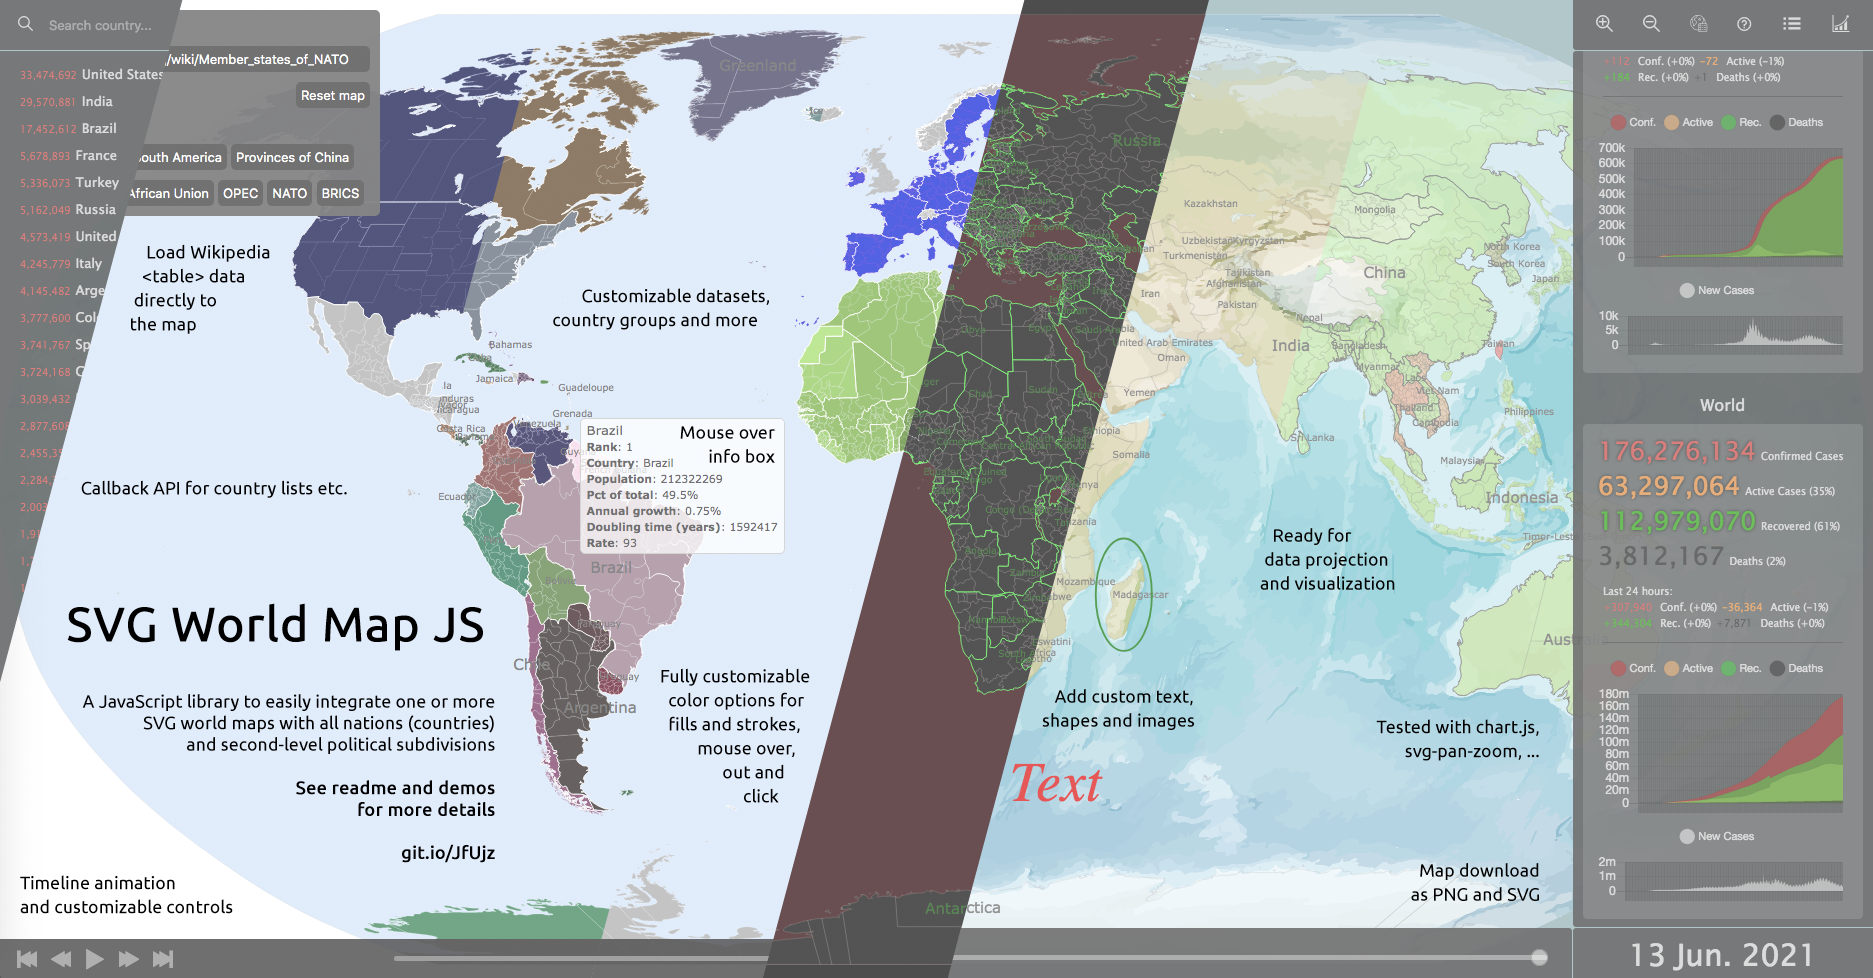
Use this map and library as boilerplate for a Strategy Game, as a Choropleth Map for Data Visualization of scientific and statistical data, or as Interactive Map for your article, paper, website or app.
This is just a small library (with a big world map) for fast and simple data projection. If you need more advanced features for data visualization and SVGs, have a look at d3js.
Attention: This library is under development and currently in early public beta phase. Use it carefully!
Showcase
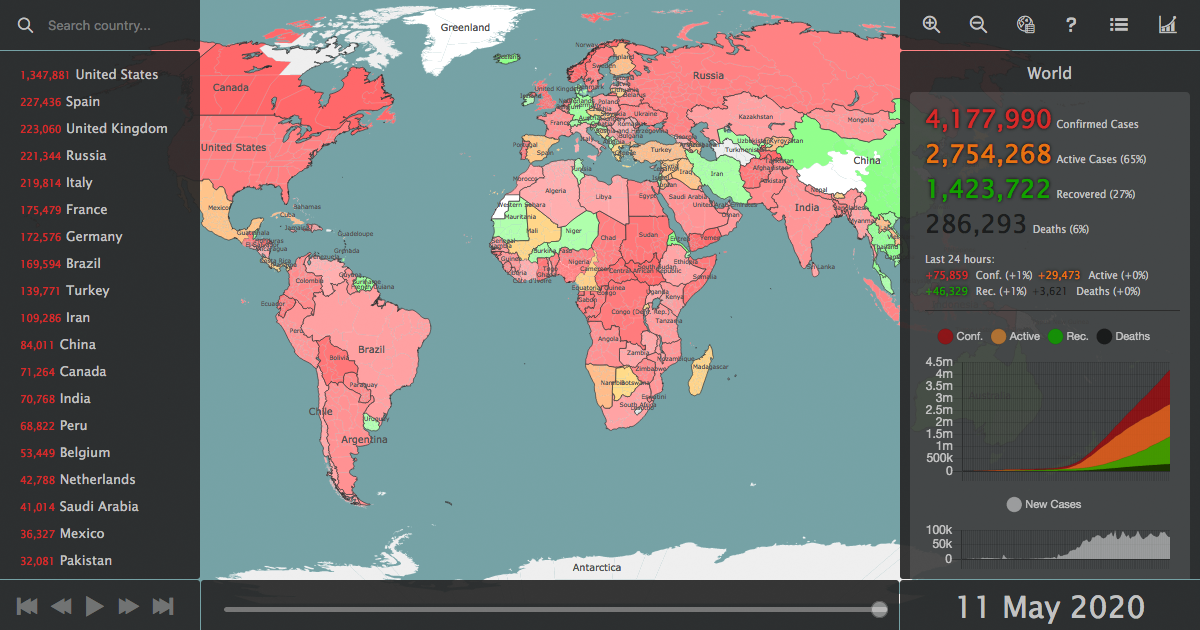
| COVID-19 Corona virus world map | Wikipedia table data projection | Wikipedia table data time animation |
|---|---|---|
 |
 |
 |
All Demos
- Basics
- Custom options
- Custom callbacks
- Custom data
- Groups, callbacks & zoom ᴢ
- Time animation and controls ᴛ ᴢ
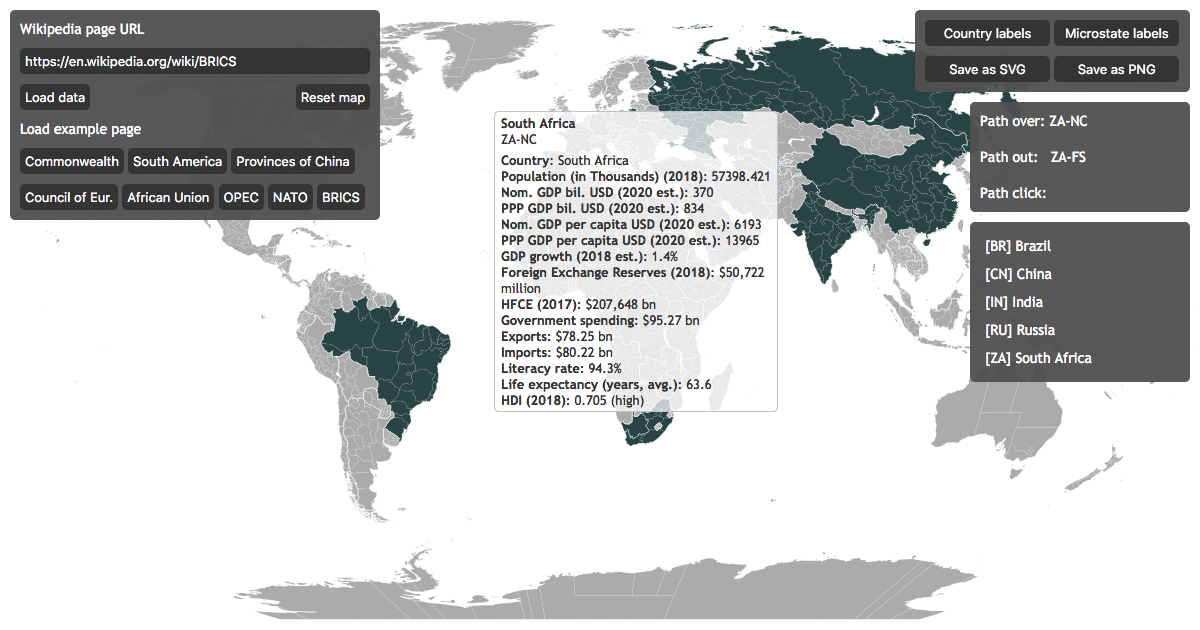
- Wikipedia table data projection
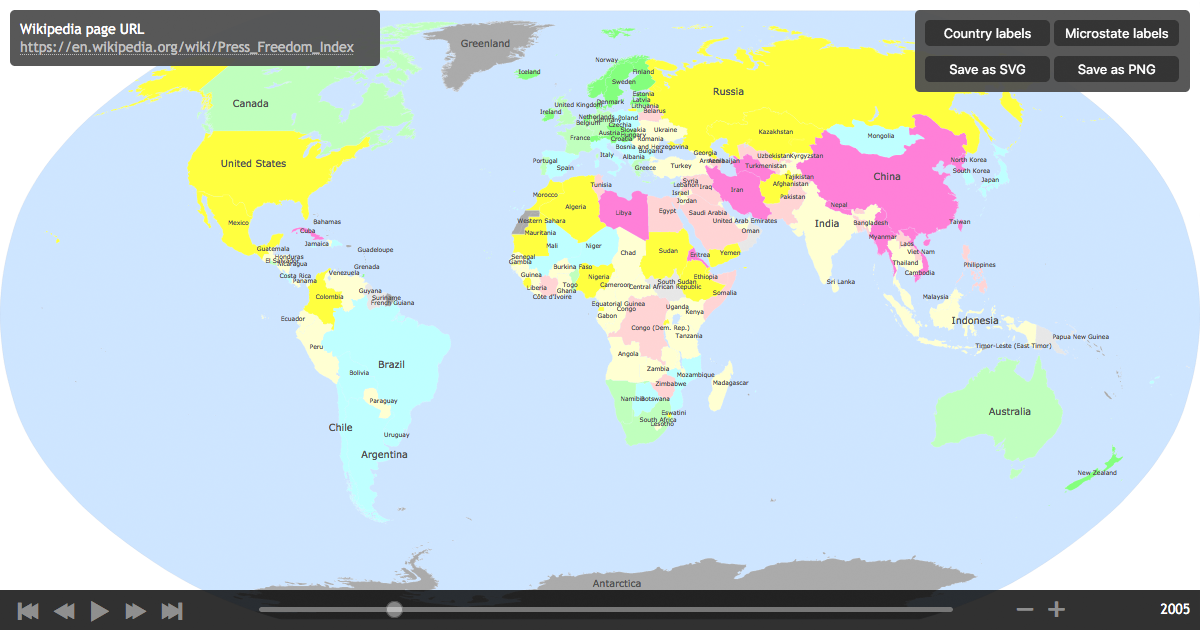
- Wikipedia table data time animation ᴛ
- COVID-19 Corona virus world map ᴛ ᴢ ᴄ ᴀ
ᴛ with Time Controls, ᴢ with svg-pan-zoom.js, ᴄ with chart.js, ᴀ data from the Coronavirus Tracker API
Upfront
What's inside
This package constists of 3 parts (which could also be used separately):
- A detailed SVG world map with 239 nations and countries and over 3000 second-level provinces and islands, ready for editing with your preferred graphics editor
- A List of all world countries with additional information, ready for use with the SVG map
- A JavaScript SVG library developed for the map and optimized for quick SVG path access, customizable with options and a callback-API, including time controls for visual data animation
To unleash the full power of SVG World Map JS you should of course use all 3 combined ;-)
World maps
Download big map: world-states-provinces.svg
Download small map: world-states.svg
The maps are based on the creative commons Blank Map World Secondary Political Divisions.svg and Blank Map World.svg from Wikimedia Commons.
Both - the big and the small map - were strongly modified to serve the purpose of this JavaScript library, so all world nations are grouped, sorted and named by their official ISO 3166-1 alpha-2 country codes.
The country paths in the SVGs are not the work of the library author. See the version history and authorship of the original files here and here.
Because of all the detailed subregions the big map has a lot of vectors and is rather large for an image (~3,8 MB).
Make sure to use the big map only, if:
- You really need a fully detailed world map with all nations, provinces and states
- Your users have a fast internet connection
Otherwise please set the bigMap paramenter in options to false. This will make the library load the small map without provinces (~1,3 MB), which is much faster.
The political subdivisions (countries, provinces, states) of the big map are mostly not named correctly, like
<path id="path12345" ...>. This issue will be addressed in future versions.
Country lists
There are 2 versions of the country list:
- A CSV file for easy editing with any office software
- A JSON file for easy integration with frontend or backend systems
The list includes 250 countries and microstates from Andorra to Zimbabwe with this additional information:
- The ISO country code, e.g. "AT"
- The country name, e.g. "Austria"
- The official longname, e.g. "The Republic of Austria"
- The countries sovereignty, e.g. "UN"
- The world region, e.g. "EU"
- The countries population (as per 2020)
- (For some countries also the provinces, e.g. "Vienna")
Note: Most political subdivisions (countries, provinces, states) are currently not included in the country list. They will be added in future versions.
The Library
Requirements
Although this project only uses frontend technologies, most browsers nowadays don't accept the file:// protocol for SVGs or JSONs, so SVG World Map needs to run on a (local) server. If you are new to HTML / SVG / JavaScript integration, please see the Pitfalls section first.
How to use
» Demo: Basics
Add the /src/ folder to your project, include svg-world-map.js in your HTML document, then call the library:
<script src="../src/svg-world-map.js"></script>
<script>svgWorldMap()</script>
This will load the SVG map via HTML injection to the top of your document body and initialize the library.
So far for the basic setup.
If you want to use the libraries callback API (see below), you need to load it with an async function:
var myWorldMap;
loadSVGWorldMap();
async function loadSVGWorldMap() {
    myWorldMap = await svgWorldMap(myCustomOptions);
    // Do something with the map...
}
Custom options
» Demo: Custom options
- All default options can be overruled by passing an object of custom options
- Set
libPath, if the library source folder is different from../src/ -
bigMapcontrols whether the map is loaded with all countries and provinces (~3,8 MB) or with nations only (~1,3 MB) - All
color,fillandstrokearguments take hex and rgb(a) values or 'none' as input - Use
showOceanandshowAntarcticato hide these layers on the map - If
showInfoBoxis set totrue, the library will add a<div id="map-infobox"></div>plus basic CSS to your page -
mapClick,mapOver,mapOut,mapTableandmapDateare callback function names, see the API section for details -
timeControlswill activate the Time Controls, see below for more information
// Default options
var options = {

    // Base path
    libPath: '../src/', // Point to library folder, e.g. (http[s]:)//myserver.com/map/src/

    // Basic options
    bigMap: true, // Set to 'false' to load small map without provinces
    showOcean: true, // Show or hide ocean layer
    showAntarctica: true, // Show or hide antarctic layer
    showLabels: true, // Show country labels
    showMicroLabels: false, // Show microstate labels
    showMicroStates: true, // Show microstates on map
    showInfoBox: false, // Show info box

    // Color options
    oceanColor: '#D8EBFF',
    worldColor: '#FFFFFF',
    labelFill: { out: '#666666',  over: '#CCCCCC',  click: '#000000' },
    countryStroke: { out: '#FFFFFF',  over: '#FFFFFF',  click: '#333333' },
    countryStrokeWidth: { out: '0.5',  over: '1',  click: '1' },
    provinceFill: { out: '#B9B9B9',  over: '#FFFFFF',  click: '#666666' },
    provinceStroke: { out: '#FFFFFF',  over: '#FFFFFF',  click: '#666666' },
    provinceStrokeWidth: { out: '0.1',  over: '0.5',  click: '0.5' },

    // Group options
    groupCountries: true, // Enable or disable country grouping
    groupBy: [ "region" ], // Sort countryData by this value(s) and return to countryGroups

    // Callback functions from the map to the outside, can have custom names
    mapOut: "mapOut",
    mapOver: "mapOver",
    mapClick: "mapClick",
    mapTable: "mapTable", // (Custom) callback function for HTML data parsing
    mapDate: "mapDate", // (Custom) callback function for time control date return

    // Time controls
    timeControls: false, // Set to 'true' for time controls
    timePause: true, // Set to 'false' for time animation autostart
    timeLoop: false //  Set to 'true' for time animation loop
};
The custom options are passed as first (optional) parameter to the map at startup. You can either hand them over as an object similar to the one above (with myCustomOptions instead of options):
myWorldMap = svgWorldMap(myCustomOptions);
Or as inline parameter:
myWorldMap = svgWorldMap({ showOcean: false, groupCountries: false, mapClick: "customMapClick" });
Map object return values
» Demo: Groups, callbacks & zoom
After initialization, the svgWorldMap() function will give you an object in return.
If the map is called like myWorldMap = svgWorldMap(), then the return data of myWorldMap looks something like this:
myWorldMap: {
    worldMap: '<object id="svg-world-map" type="image/svg+xml" data="../src/world-states-provinces.svg">',
    countries: { AD: '<g id="AD">', AE: '<g id="AE">', ... },
    countryData: { AD: { name: "Andorra", longname: ... }, ... },
    countryGroups: { region: { AF: {...}, AN: {...}, ... }, ... },
    countryLabels: { AD: '<text id="AD-label">', AE: '<text id="AE-label">', ... },
    out: function(id) { ... }, // Calling home functions from outside into the map
    over: function(id) { ... },
    click: function(id) { ... },
    update: function(data) { ... },
    reset: function(data) { ... },
    labels: function(data) { ... },
    download: function(data) { ... },
    table: function(data) { ... },
    date: function(data) { ... }
};
Let's break this down in detail, as each return object can be very useful:
The Map SVG
The svgWorldMap.worldMap is either the big SVG world map with all countries and provinces or the small map without provinces, only nations. If the library detects a small mobile device, it will automatically load the small map. You can force the small map by setting options.bigMap to false.
Country list
This sub object svgWorldMap.countries includes a list of all top level countries (the main groups in the SVG), where key is the country code and value is the <g id="AD"> group element (which includes all sub provinces).
There are also some special informations added directly to the <g> and all child <path> elements, which can come in very handy for quick element and information access. Let's have a look at Canada:
svgWorldMap.countries['CA']: <g id="CA">: {
    ...
    border: '<path id="ca" fill="none" stroke="#FFFFFF" stroke-width="0.5" d="...">', // Border path (= nation path stroke)
    country: '<g id="CA">'; // The group element of the main country
    name: 'Canada';
    region: 'NA'; // North America
    provinces: [ '<path id="CA-AB" fill="#B9B9B9" ...>', '<path id="CA-BC" fill="#B9B9B9" ...>', ... ]; // Array with all sub-province paths
    ...
}
The political subdivisions (countries, provinces, states) are mostly not named correctly, like
<path id="path12345" ...>. This issue will be addressed in future versions.
Country data
The svgWorldMap.countryData is a copy of the (optional) countryData parameter at startup (see next section) or the fallback data from the library. If you don't modify the basic country data, this object inculdes the following information:
svgWorldMap.countryData['CA']: {
    name: "Canada",
    region: "NA", // North America
}
If you load the basic cutom data from country-data.json (see below), the data provides a little more (and is also added to each country in svgWorldMap.countries):
svgWorldMap.countryData['CA']: {
    name: "Canada",
    longname: "Canada",
    region: "NA", // North America
    sovereignty: "UN" // United Nations member state
    population: 37958039,
    provinces: { // Note: Most countries currently don't have province detail data
        "CA-AB": { name: "Alberta", capital: "Edmonton", population: 4413146 },
        "CA-BC": { name: "British Columbia", capital: "Victoria", population: 5110917 }, ...
    }
}
Country groups
| » Demo: Groups, callbacks & zoom |
Country groups are an essential feature of the SVG World Map library and can help you access a whole bunch of countries simultaneously. Countries are grouped by the information of the svgWorldMap.countryData explained before. By default, the countries are grouped by their respective world region, so svgWorldMap.countryGroups contains the data as follows:
svgWorldMap.countryGroups.region: {
AF: { // Africa
AO: '<g id="AO">', // Angola
BF: '<g id="BF">', // Burkina Faso
BI: '<g id="BI">', // Burundi
...
ZA: '<g id="ZA">', // South Africa
ZM: '<g id="ZM">', // Zambia
ZW: '<g id="ZW">' // Zimbabwe
},
AN: { '<g id="AQ">', ... }, // Antarctica
AS: { '<g id="AE">', ... }, // Asia
EU: { '<g id="AD">', ... }, // Europe
NA: { '<g id="AG">', ... }, // North America
OC: { '<g id="AS">', ... }, // Australia & Oceania
SA: { '<g id="AR">', ... } // South America
}
Groups can be deactivated by setting the options.groupCountries value to false (default is true):
myWorldMap = svgWorldMap({ groupCountries: false });
If you want to add a country group, you have to add the category key from country data to the options.groupBy. Let's say we also want a sovereignty group, then the options would have to look like:
myCustomOptions = {
    ...
    groupCountries: true,
    groupBy: [ "region", "sovereignty" ], // Sort countryData by this value(s) and return to countryGroups
};
myWorldMap = svgWorldMap(myCustomOptions);
Country labels
The labels are a group in the SVG map and are sorted like the country list. They are basically controlled via the labels() API function (see there). Each one has a attribute called microstate which can be true or false:
svgWorldMap.countryLabels['AD']: <text id="AD-label">: {
    ...
    microstate: true,
    ...
}
Country over(), out(), click(), update(), reset(), labels(), download(), table() and date()
All these functions are part of the API, please see below for further information.
Changing the basic country data
» Demo: Custom data
There's two kinds of data for countries:
- The initial country data is passed as a JSON object in the same format as the country-data.json
- There's an update map API-call. For further information about manipulating the country color at runtime, see the sections below.
If you want to add custom data from a modified country list in CSV format, please covert it to a keyed JSON file. A good CSV to JSON converter can be found here (make sure to select "CSV to keyed JSON"). CSV import will be added in future versions.
JSON format
To add or change the country information on startup, you can simply pass your JSON data to the svgWorldMap() as second (optional) parameter (the first one is options).
myWorldMap = svgWorldMap({}, countryData);
The library will then do the logic: For example, you could upload your own list with the country population in the year 1000 or change all the countries names with planet names from Star Trek. In that case, you would have to change the country data from this...
var countryData = {
    AD: {
        name: "Andorra",
        longname: "The Principality of Andorra",
        sovereignty: "UN",
        region: "EU"
    }, ...
}
...to this:
var countryData = {
    AD: {
        name: "Andoria",
        longname: "Andorian Empire",
        sovereignty: "UFP", // United Federation of Planets
        region: "AQ" // Alpha Quadrant
    }, ...
}
Note: You can change all country information except the ISO country code, which is the identifier for the corresponding map path.
Callback and home APIs
» Demo: Custom callbacks
» Demo: Wikipedia table data projection
» Demo: Wikipedia table data time animation
Calling back from the map
As seen in the options setup, there are five callback functions for over, out, click, table and date, which can also have custom names:
var options = {
    // Callback functions from the map to the outside, can have custom names
    mapOut: "myCustomOut",
    mapOver: "myCustomOver",
    mapClick: "myCustomClick",
    mapTable: "myCustomTable",
    mapDate: "myCustomDate",
};
With the callback of these functions you can catch the hovered or clicked country, get the return JSON from a parsed HTML table or receive the current date of the Time Controls (see below). Let's say you named your functions "myCustomClick()", "myCustomOver()", "myCustomOut()", "myCustomTable()" and "myCustomDate()", then the code would look something like this:
function myCustomClick(country) {
    var countryId = country.id; // Id of the clicked path on the map
    ...
}

function myCustomOver(country) {
    var countryId = country.id; // Id of the hovered over path
    ...
}

function myCustomOut(country) {
    var countryId = country.id; // Id of the hovered out path
    ...
}

function myCustomTable(object) {
    var tableData = object; // JSON of the parsed HTML table (e.g. from a Wikipedia country list)
    ...
}

function myCustomDate(date) {
    var currentDay = date; // Callback for the current date (e.g. day, month, year) from the Time Controls
    ...
}
Calling home to the map
There are 9 calling home functions, 3 for country over(), out() and click(), then update() and reset() for (un)coloring countries, a label() control and a download() function, the HTML table() parser and date() (the last one is just a routing helper for mapDate).
-
over(),out()andclick()will trigger the attribute changes forfill,strokeandstroke-widthdefined inoptions. They only need the country id parameter:myWorldMap.out('AT'); myWorldMap.over('AT'); myWorldMap.click('AT');
Or as inline HTML:
<li id="AT" onmouseover="myWorldMap.over('AT')" onmouseout="myWorldMap.out('AT')" onclick="myWorldMap.click('AT')">Austria</li>
-
update()changes the fill color of one or more countries at once. The input object uses the same format assvgWorldMap.countries. Each country can have an individual color, which will stay the same on mouseover. The data is passed via country id and a color value:myWorldMap.update({ DE: '#00FF00', AT: '#00FF00', CH: '#00FF00' });
-
reset()will revert all country attributes likefill,strokeandstroke-widthto their initaloutstate:<button onclick="myWorldMap.reset()">Reset map</button>
-
labels()toggles the visibility of the country labels on and off. The input parameter can be"all"or"micro"(for microstates):<button onclick="myWorldMap.labels('all')">Show labels</button>
-
download()triggers an export of the current map state. The input parameter can be"svg"or"png":<button onclick="myWorldMap.download('png')">Save as PNG</button>
-
table()accepts a HTML string and will try to DOM parse it and find a valid<table>with 'iso', 'country', 'state', 'name', 'nation', etc. in the<th>table headers. If such a table is found, the data inside will be scraped, sorted and returned as JSON object, ordered by the country (ISO) key. As the data parsing runs asynchronously, you have to catch the JSON via themapTable()callback function mentioned above.» Demo: Wikipedia table data projection Fire the calling home function with any HTML string (no URL or DOM object):
myWorldMap.table(htmlstring);
Then catch the callback with the returned JSON (function can have a custom name, defined in options):
function mapTable(object) {
    var tableData = object; // JSON of the parsed HTML table (e.g. from a Wikipedia country list)
    ...
}
Time Controls
» Demo: Time animation and controls
» Demo: Wikipedia table data time animation
» Demo: COVID-19 Corona virus world map
The SVG World Map library includes Time Controls for animated data visualization, to provide an easy integration of time series data on the map with changing colors for each country or province.
Before activating the Time Controls, make sure to have the webfont folder
/src/font/...included in your project.
- Set the options parameter
timeControlstotrueto acivate the Time Controls - Use
timePauseandtimeLoopfor further adjustments -
mapDateis the custom callback function (see above)
myTimeOptions = {
    timeControls: true, // Set to 'true' for time controls
    timePause: true, // Set to 'false' for time animation autostart
    timeLoop: false //  Set to 'true' for time animation loop
    mapDate: "myCustomDate", // (Custom) callback function for time control date return
};

myWorldMap = svgWorldMap(myTimeOptions);
This will:
- Load the flaticon webfont for the control icons
- Add (prepend) some CSS before the closing
</head>tag - Add HTML to a new
<div id="map-controls">element inside the<div id="svg-world-map-container">
Please override the CSS as you like to change or hide the added HTML elements.
The following code shows the injected CSS / HTML for clarification. The library will do this automatically, no need to copy this.
<html>
    <head>
        ...
        <link rel="stylesheet" href="../src/font/flaticon.css">
        <style>
            #map-controls { position: absolute; bottom: 0; left: 0; right: 0; width: auto; height: 40px; padding: 0 10px; background-color: rgba(0, 0, 0, .75); }
            #map-control-buttons, #map-slider-container, #map-speed-controls, #map-date { float: left; }
            #map-control-buttons { width: 20%; }
            ...
        </style>
    </head>
    <body>
        <div id="svg-world-map-container">
            <!-- SVG map -->
            <object id="svg-world-map" type="image/svg+xml" data=".. /src/world-states-provinces.svg"></object>
            <!-- Info box -->
            <div id="map-infobox"></div>
            <!-- Map time controls -->
            <div id="map-controls">
                <div id="map-control-buttons">
                    <button id="map-control-start" onclick="clickControl()"><i class="flaticon-previous"></i></button>
                    <button id="map-control-back" onclick="clickControl()"><i class="flaticon-rewind"></i></button>
                    <button id="map-control-play-pause" onclick="clickPlayPause()"><i class="flaticon-pause"></i></button>
                    <button id="map-control-forward" onclick="clickControl()"><i class="flaticon-fast-forward"></i></button>
                    <button id="map-control-end" onclick="clickControl()"><i class="flaticon-skip"></i></button>
                </div>
                <div id="map-slider-container">
                    <input id="map-slider" type="range" min="0" max="10">
                </div>
                <div id="map-speed-controls">
                    <button id="map-control-slower" onclick="clickSpeed()"><i class="flaticon-minus"></i></button>
                    <button id="map-control-faster" onclick="clickSpeed()"><i class="flaticon-plus"></i></button>
                </div>
                <div id="map-date"></div>
            </div>
        </div>
        ...
    </body>
</html>
Without a time series dataset (see below) only the controls (play, pause, forward, faster, ...) and the ticks per day (or month, year, ...) logic will be added to the map. The control buttons and the current date will be shown, but the time slider will not be visible (as there is no end date).
To catch the callback when the map goes to the next date, just use the callback function mentioned before:
function myCustomDate(date) {
    var currentDay = date; // Callback for the current date (e.g. day, month, year) from the Time Controls
    ... // Do something with the new date
}
Country data time animation
To animate the color of countries from one date to the next, you have to pass an array or object with the dates and the country colors (as sub objects) to the svgWorldMap() main function as third parameter (after options and country data).
The inner data for each date is similar to the data passed to the update() function or as the svgWorldMap.countries return object.
Let's say you want to highlight the Baltic states Estonia, Latvia und Lithuania after each other, then the code would look something like this:
// Pass time series data as array...
myTimeData = [
    { 'Date 1': { EE: '#1E37EE', LV: '#FFFFFF', LT: '#FFFFFF' } },
    { 'Date 2': { EE: '#FFFFFF', LV: '#9C1733', LT: '#FFFFFF' } },
    { 'Date 3': { EE: '#FFFFFF', LV: '#FFFFFF', LT: '#FBB934' } }
];

// ...or as object
myTimeData = {
    'Date 1': { EE: '#1E37EE', LV: '#FFFFFF', LT: '#FFFFFF' },
    'Date 2': { EE: '#FFFFFF', LV: '#9C1733', LT: '#FFFFFF' },
    'Date 3': { EE: '#FFFFFF', LV: '#FFFFFF', LT: '#FBB934' }
};

// Init map
myWorldMap = svgWorldMap(myTimeOptions, false, myTimeData); // countryData can be false, but not empty
Further Development & Changelog
TODOs
- Add game controls
- Add strategy game demo
- Add capitals to countrydata
- Add bubbles / circles to the map
- Add minified JS and CSS files
- Optimize drag and click
- Optimize zoom integration
- Test support for Node.js & Typescript
- Modify the library for use with other SVG maps (RPG gamers, I'm talking to you!)
- Name all provinces in the SVGs correctly (This may take a while... Help appreciated!)
- Name all provinces in the JSON and CSV correctly (This may take a while... Help appreciated!)
- Integrate Web Animations (currently W3C working draft)
Done
- 0.2.2
- Added LICENSE
- Merged the time controls module into the main library since .mjs files are not supported well by all servers
- Added option for library path
- 0.2.1
- Improved Corona virus data visualization demo
- 0.2.0
- Optimized CSS for Windows and mobile devices
- Fixed map loading and info box bug
- 0.1.9
- Added map download function for SVG & PNG
- Added details to info box
- Improved coloring example in Wikipedia table demo
- Made README sections collapsible
- 0.1.8
- Added Wikipedia (and other) HTML time data import
- Added Wikipedia time animation demo
- Added Showcase to README
- 0.1.7
- Moved JS, CSS and images for demos to subfolders
- Fixed play / pause bug in time controls
- 0.1.6
- Moved map initialization to library
- Added small SVG map for mobile devices and to options
- Added mobile detection
- 0.1.5
- Added Wikipedia (and other) HTML table import
- Added Wikipedia table import demo
- Added mouse over info box
- Added map reset function
- 0.1.4
- Added library addon module for time controls and animation
- Added time data visualization demo
- Tested node live server support
- 0.1.3
- Improved Corona virus map demo
- Tested basic mobile support
- 0.1.2
- Added Corona virus data visualization demo
- Improved provinces handling
- 0.1.1
- Improved country over, out, click
- Added country labels (names) to the map
- Added microstate handling
- 0.1.0
- Cleanup SVG
- Added population to country data
- 0.0.9
- Fixed path bugs
- Added basic demos
- Added further options
- Improved callback API
Pitfalls, Known Issues & Bugs
Pitfalls
- A lot of problems with SVGs include loading issues, make sure the SVG is fully loaded before you initialize the library
- SVGs can not be called via
file://, so make sure you have a (local) server for this library (although it's completely frontend) - Most browsers don't accept a mix of
http://andhttps://, this can also affect SVG or JSON loading
Known Issues & Bugs
- If you use svg-pan-zoom.js, it will crop the download image because of the inserted
<g id="viewport-..." class="svg-pan-zoom_viewport" ...> - Currently several small bugs, mainly SVG path related
- Slow or old computers or bad internet conncetion may show nothing but the map
- If you find a bug, be nice to it (and also let me know of it) ;-)
License
SVG World Map JS is available under the MIT license.