dreamRs / Tuicalendr
Licence: other
📆 R htmlwidget for tui-calendar
Stars: ✭ 53
Programming Languages
r
7636 projects
Projects that are alternatives of or similar to Tuicalendr
Billboarder
📊 R Htmlwidget for billboard.js
Stars: ✭ 159 (+200%)
Mutual labels: data-visualization, htmlwidgets
Streamgraph
〰️ htmlwidget for creating streamgraph visualizations in R
Stars: ✭ 137 (+158.49%)
Mutual labels: data-visualization, htmlwidgets
Satellite imagery analysis
Implementation of different techniques to find insights from the satellite data using Python.
Stars: ✭ 31 (-41.51%)
Mutual labels: data-visualization
Data Science Lunch And Learn
Resources for weekly Data Science Lunch & Learns
Stars: ✭ 49 (-7.55%)
Mutual labels: data-visualization
Awesome Biological Visualizations
A list of web-based interactive biological data visualizations.
Stars: ✭ 40 (-24.53%)
Mutual labels: data-visualization
Dataconfs
A list of conferences connected with data worldwide.
Stars: ✭ 36 (-32.08%)
Mutual labels: data-visualization
Kepler.gl
Kepler.gl is a powerful open source geospatial analysis tool for large-scale data sets.
Stars: ✭ 8,231 (+15430.19%)
Mutual labels: data-visualization
Metrotwitter
What Twitter reveals about the differences between cities and the monoculture of the Bay Area
Stars: ✭ 52 (-1.89%)
Mutual labels: data-visualization
Promcord
📊 Analyze your entire discord guild in grafana using prometheus. Message, User, Game and Voice statistics...
Stars: ✭ 39 (-26.42%)
Mutual labels: data-visualization
Svg World Map
🗺 A JavaScript library to easily integrate one or more SVG world maps with all nations (countries) and second-level political subdivisions (countries, provinces, states).
Stars: ✭ 38 (-28.3%)
Mutual labels: data-visualization
Leaflet.extras2
Extra functionality for leaflet R package.
Stars: ✭ 37 (-30.19%)
Mutual labels: data-visualization
Vitessce
Vitessce is a visual integration tool for exploration of spatial single-cell experiments.
Stars: ✭ 42 (-20.75%)
Mutual labels: data-visualization
Drugs Recommendation Using Reviews
Analyzing the Drugs Descriptions, conditions, reviews and then recommending it using Deep Learning Models, for each Health Condition of a Patient.
Stars: ✭ 35 (-33.96%)
Mutual labels: data-visualization
Vue Data Board
A Data Analysis Board in Vue.
Stars: ✭ 1,046 (+1873.58%)
Mutual labels: data-visualization
Awesome Creative Coding
Creative Coding: Generative Art, Data visualization, Interaction Design, Resources.
Stars: ✭ 8,696 (+16307.55%)
Mutual labels: data-visualization
Tofu
Project for an open-source python library for synthetic diagnostics and tomography for Fusion devices
Stars: ✭ 35 (-33.96%)
Mutual labels: data-visualization
Soccergraphr
Soccer Analytics in R using OPTA data
Stars: ✭ 42 (-20.75%)
Mutual labels: data-visualization
Leaflet Swoopy
⤵️ Swoopy Arrow Plugin for Leaflet
Stars: ✭ 52 (-1.89%)
Mutual labels: data-visualization
tuicalendr
Htmlwidget to create interactive calendar with JavaScript library tui-calendar
Installation
You can install from GitHub with:
remotes::install_github("dreamRs/tuicalendr")
Examples
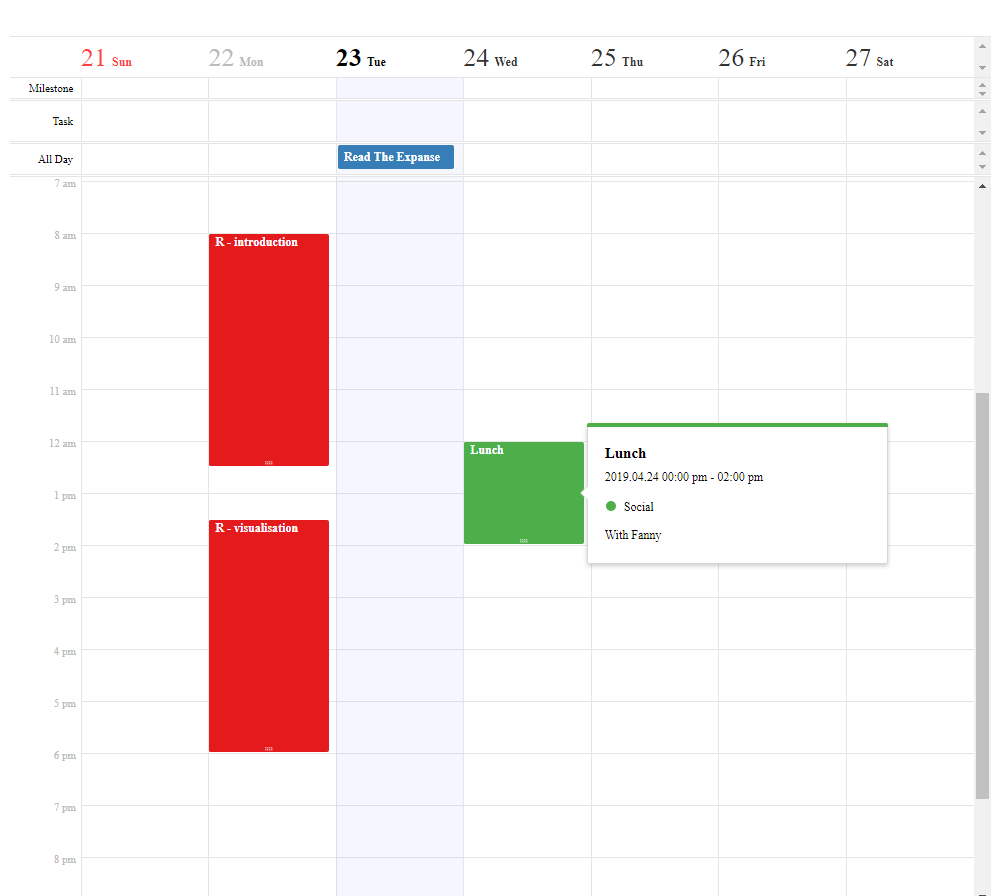
Weekly calendar:
library(tuicalendr)
calendar(defaultView = "week", taskView = TRUE, scheduleView = c("time", "allday")) %>%
  set_calendars_props(id = "courses", name = "Courses", color = "#FFF", bgColor = "#E41A1C") %>%
  set_calendars_props(id = "hobbies", name = "Hobbies", color = "#FFF", bgColor = "#377EB8") %>%
  set_calendars_props(id = "social", name = "Social", color = "#FFF", bgColor = "#4DAF4A") %>%
  add_schedule(
    calendarId = "courses",
    title = "R - introduction",
    body = "What is R?",
    start = sprintf("%s 08:00:00", Sys.Date() - 1),
    end = sprintf("%s 12:30:00", Sys.Date() - 1),
    category = "time"
  ) %>%
  add_schedule(
    calendarId = "courses",
    title = "R - visualisation",
    body = "With ggplot2",
    start = sprintf("%s 13:30:00", Sys.Date() - 1),
    end = sprintf("%s 18:00:00", Sys.Date() - 1),
    category = "time"
  ) %>%
  add_schedule(
    calendarId = "hobbies",
    title = "Read The Expanse",
    body = "Vol. 5 : Nemesis Games",
    start = Sys.Date(),
    end = Sys.Date(),
    category = "allday"
  ) %>%
  add_schedule(
    calendarId = "social",
    title = "Lunch",
    body = "With Fanny",
    start = sprintf("%s 12:00:00", Sys.Date() + 1),
    end = sprintf("%s 14:00:00", Sys.Date() + 1),
    category = "time"
  )
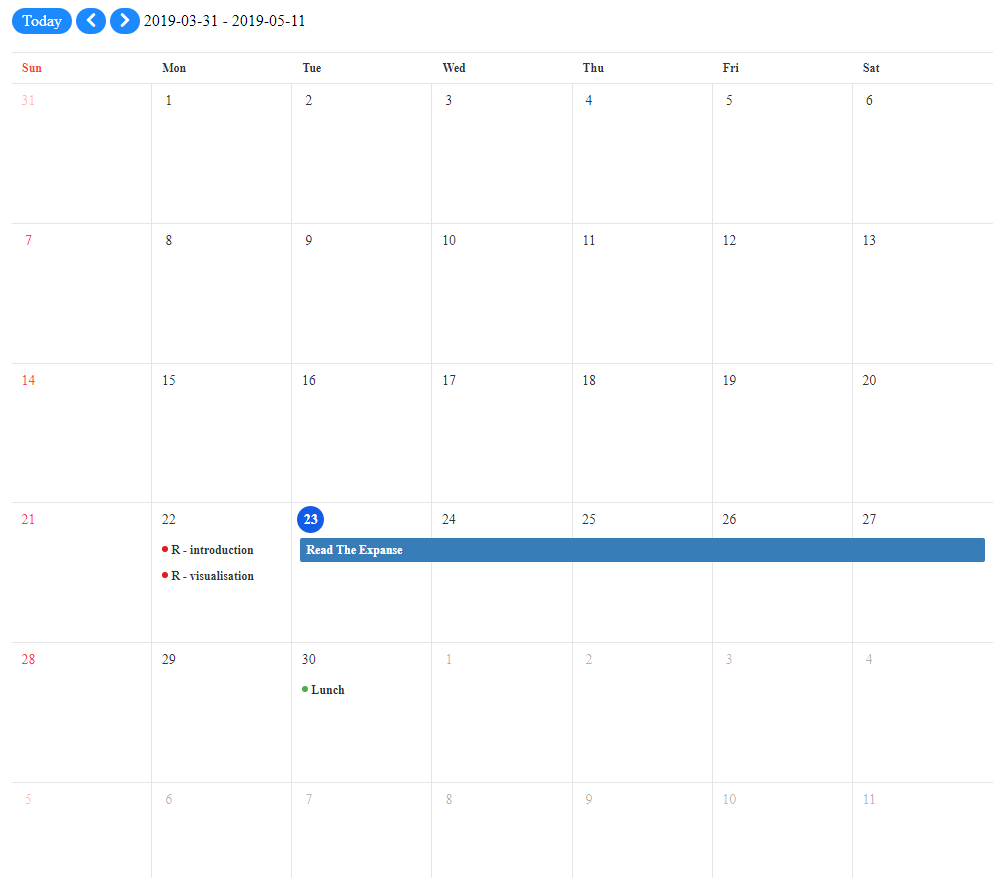
Month calendar:
calendar(defaultView = "month", taskView = TRUE, scheduleView = c("time", "allday"), useNav = TRUE) %>%
  set_calendars_props(id = "courses", name = "Courses", color = "#FFF", bgColor = "#E41A1C") %>%
  set_calendars_props(id = "hobbies", name = "Hobbies", color = "#FFF", bgColor = "#377EB8") %>%
  set_calendars_props(id = "social", name = "Social", color = "#FFF", bgColor = "#4DAF4A") %>%
  add_schedule(
    calendarId = "courses",
    title = "R - introduction",
    body = "What is R?",
    start = sprintf("%s 08:00:00", Sys.Date() - 1),
    end = sprintf("%s 12:30:00", Sys.Date() - 1),
    category = "time"
  ) %>%
  add_schedule(
    calendarId = "courses",
    title = "R - visualisation",
    body = "With ggplot2",
    start = sprintf("%s 13:30:00", Sys.Date() - 1),
    end = sprintf("%s 18:00:00", Sys.Date() - 1),
    category = "time"
  ) %>%
  add_schedule(
    calendarId = "hobbies",
    title = "Read The Expanse",
    body = "Vol. 5 : Nemesis Games",
    start = Sys.Date(),
    end = Sys.Date() + 4,
    category = "allday"
  ) %>%
  add_schedule(
    calendarId = "social",
    title = "Lunch",
    body = "With Fanny",
    start = sprintf("%s 12:00:00", Sys.Date() + 7),
    end = sprintf("%s 14:00:00", Sys.Date() + 7),
    category = "time"
  )
Note that the project description data, including the texts, logos, images, and/or trademarks,
for each open source project belongs to its rightful owner.
If you wish to add or remove any projects, please contact us at [email protected].


