dreamRs / Billboarder
Programming Languages
Projects that are alternatives of or similar to Billboarder
billboarder
Htmlwidget for billboard.js
Overview
This package allow you to use billboard.js, a re-usable easy interface JavaScript chart library, based on D3 v4+.
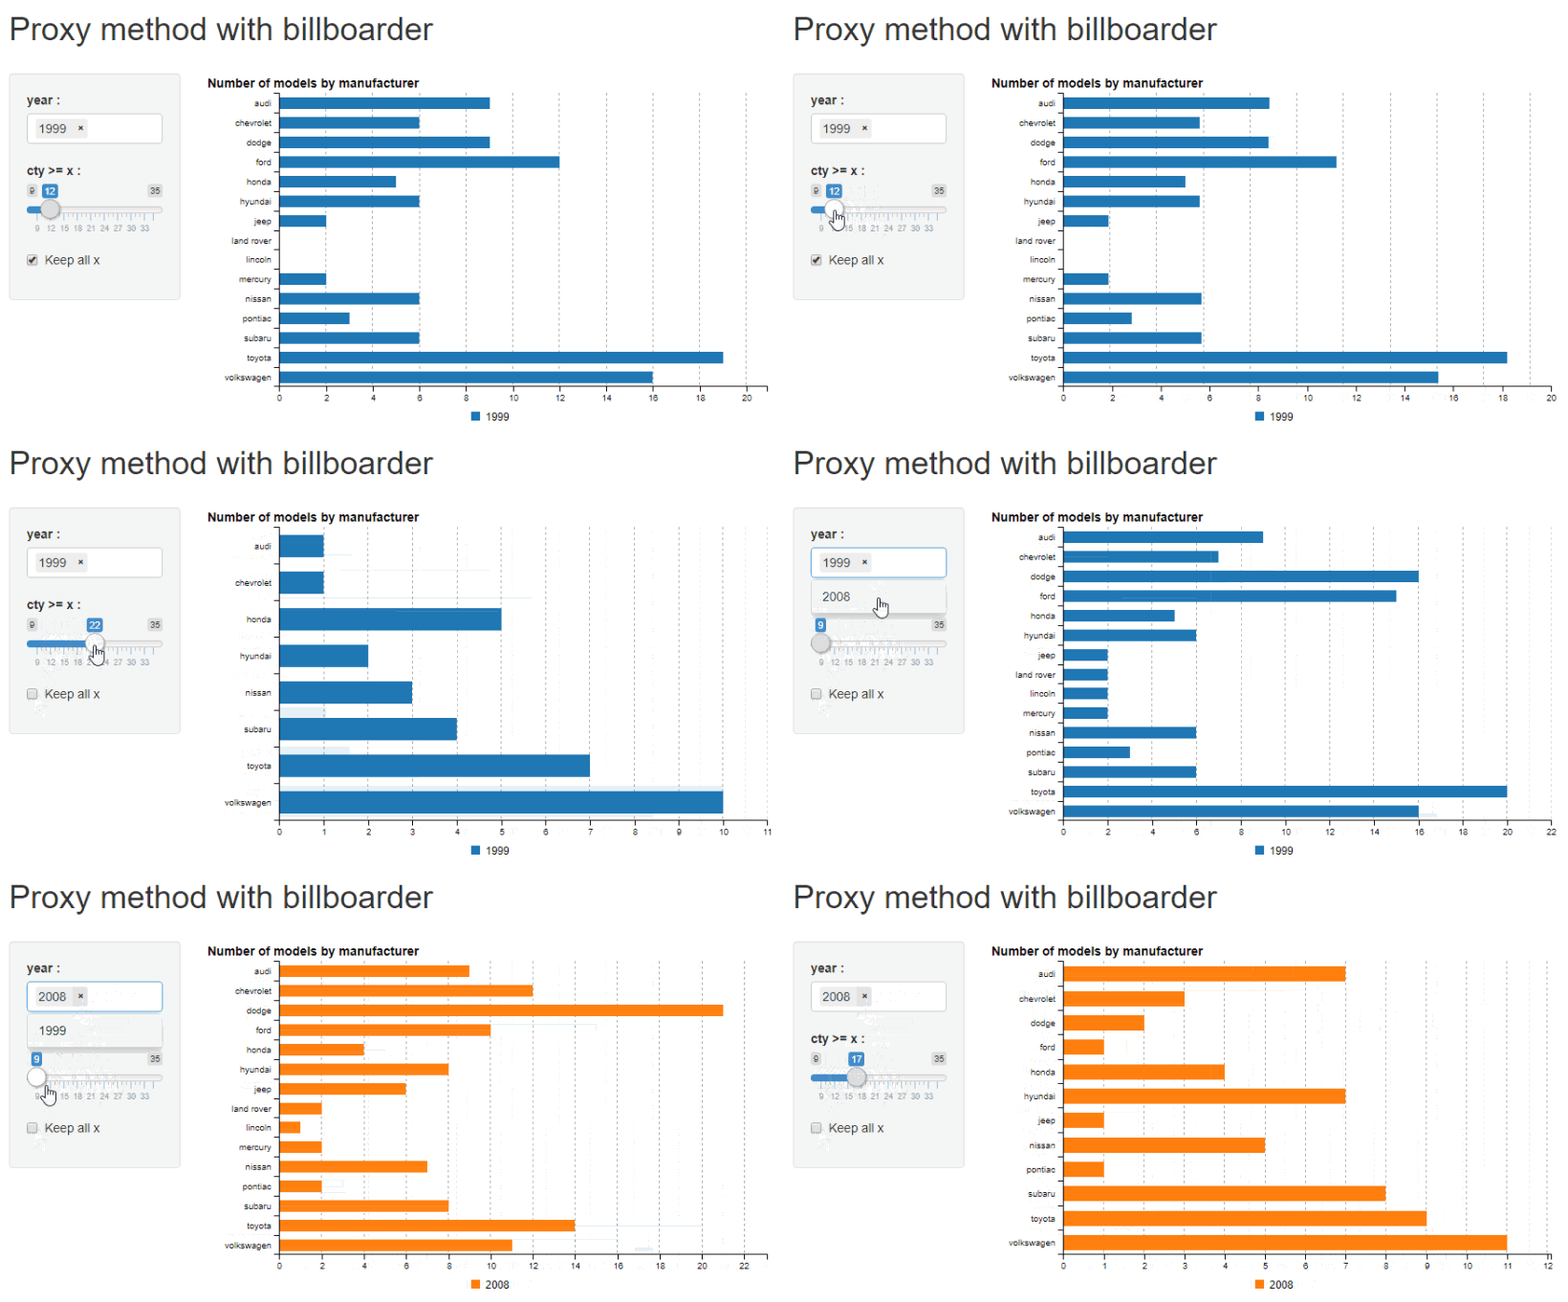
A proxy method is implemented to smoothly update charts in shiny applications, see below for details.
Note : Development is heavily inspired by awesome highcharter by Joshua Kunst.
Installation :
# From CRAN
install.packages("billboarder")

# From Github
# install.packages("devtools")
devtools::install_github("dreamRs/billboarder")
For interactive examples & documentation, see pkgdown site : https://dreamrs.github.io/billboarder/index.html
Other examples:
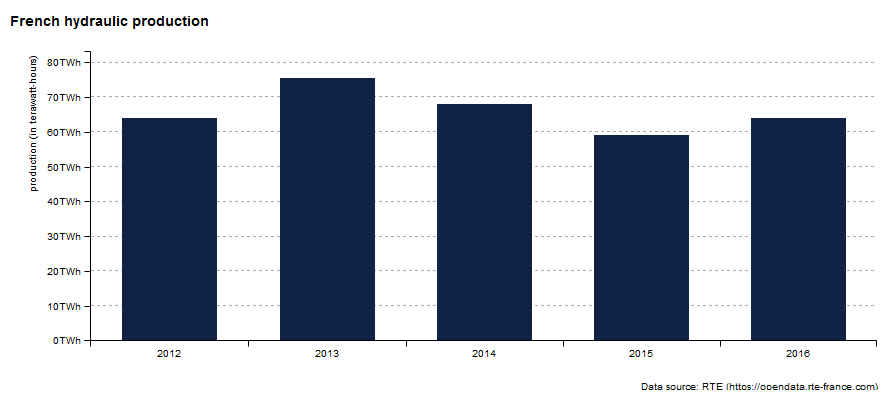
Bar chart
You can do barcharts !
library("billboarder")

# data
data("prod_par_filiere")

# a bar chart !
billboarder() %>%
  bb_barchart(data = prod_par_filiere[, c("annee", "prod_hydraulique")], color = "#102246") %>%
  bb_y_grid(show = TRUE) %>%
  bb_y_axis(tick = list(format = suffix("TWh")),
            label = list(text = "production (in terawatt-hours)", position = "outer-top")) %>%
  bb_legend(show = FALSE) %>%
  bb_labs(title = "French hydraulic production",
          caption = "Data source: RTE (https://opendata.rte-france.com)")
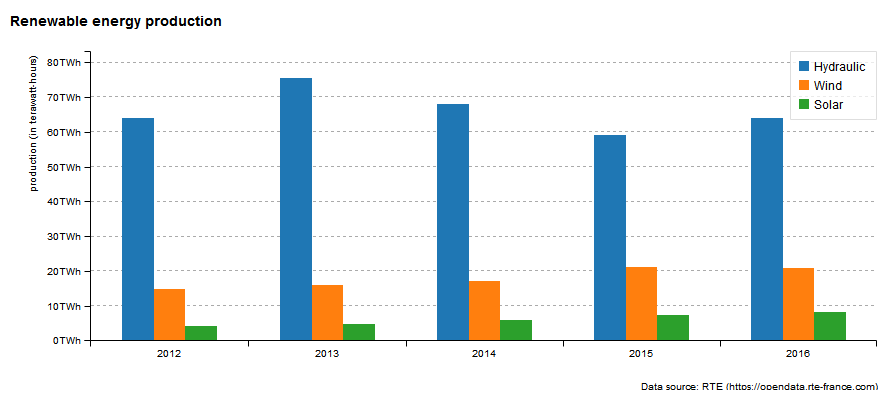
And dodge bar chart too !
library("billboarder")

# data
data("prod_par_filiere")

# dodge bar chart !
billboarder() %>%
  bb_barchart(
    data = prod_par_filiere[, c("annee", "prod_hydraulique", "prod_eolien", "prod_solaire")]
  ) %>%
  bb_data(
    names = list(prod_hydraulique = "Hydraulic", prod_eolien = "Wind", prod_solaire = "Solar")
  ) %>%
  bb_y_grid(show = TRUE) %>%
  bb_y_axis(tick = list(format = suffix("TWh")),
            label = list(text = "production (in terawatt-hours)", position = "outer-top")) %>%
  bb_legend(position = "inset", inset = list(anchor = "top-right")) %>%
  bb_labs(title = "Renewable energy production",
          caption = "Data source: RTE (https://opendata.rte-france.com)")
Even stacked bar charts !
library("billboarder")

# data
data("prod_par_filiere")

# stacked bar chart !
billboarder() %>%
  bb_barchart(
    data = prod_par_filiere[, c("annee", "prod_hydraulique", "prod_eolien", "prod_solaire")],
    stacked = TRUE
  ) %>%
  bb_data(
    names = list(prod_hydraulique = "Hydraulic", prod_eolien = "Wind", prod_solaire = "Solar"),
    labels = TRUE
  ) %>%
  bb_colors_manual(
    "prod_eolien" = "#41AB5D", "prod_hydraulique" = "#4292C6", "prod_solaire" = "#FEB24C"
  ) %>%
  bb_y_grid(show = TRUE) %>%
  bb_y_axis(tick = list(format = suffix("TWh")),
            label = list(text = "production (in terawatt-hours)", position = "outer-top")) %>%
  bb_legend(position = "right") %>%
  bb_labs(title = "Renewable energy production",
          caption = "Data source: RTE (https://opendata.rte-france.com)")
Scatter plot
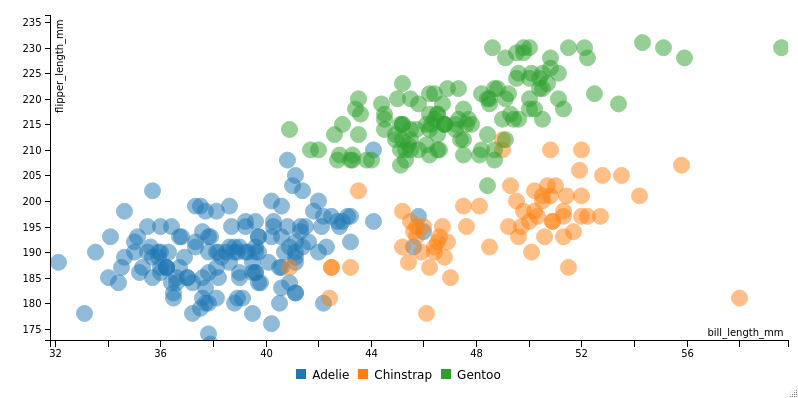
Classic :
billboarder() %>%
 bb_scatterplot(data = iris, x = "Sepal.Length", y = "Sepal.Width", group = "Species") %>%
 bb_axis(x = list(tick = list(fit = FALSE))) %>%
 bb_point(r = 8)
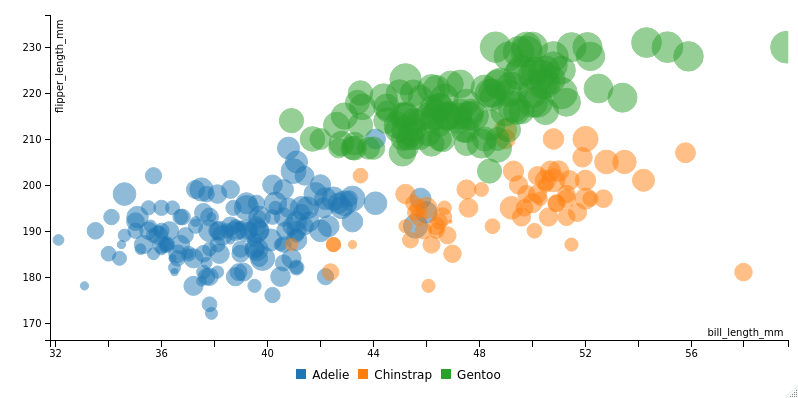
You can make a bubble chart using size aes :
billboarder() %>%
  bb_scatterplot(
    data = iris,
    mapping = bbaes(Sepal.Length, Sepal.Width, group = Species, size = Petal.Width),
    range = c(0.5, 120)
  ) %>%
  bb_x_axis(tick = list(fit = FALSE))
Pie charts
If you have to, you can do pie charts !
library("billboarder")

# data
data("prod_par_filiere")
nuclear2016 <- data.frame(
  sources = c("Nuclear", "Other"),
  production = c(
    prod_par_filiere$prod_nucleaire[prod_par_filiere$annee == "2016"],
    prod_par_filiere$prod_total[prod_par_filiere$annee == "2016"] -
      prod_par_filiere$prod_nucleaire[prod_par_filiere$annee == "2016"]
  )
)

# pie chart !
billboarder() %>%
  bb_piechart(data = nuclear2016) %>%
  bb_labs(title = "Share of nuclear power in France in 2016",
          caption = "Data source: RTE (https://opendata.rte-france.com)")
You can also do donut charts.
Lines charts
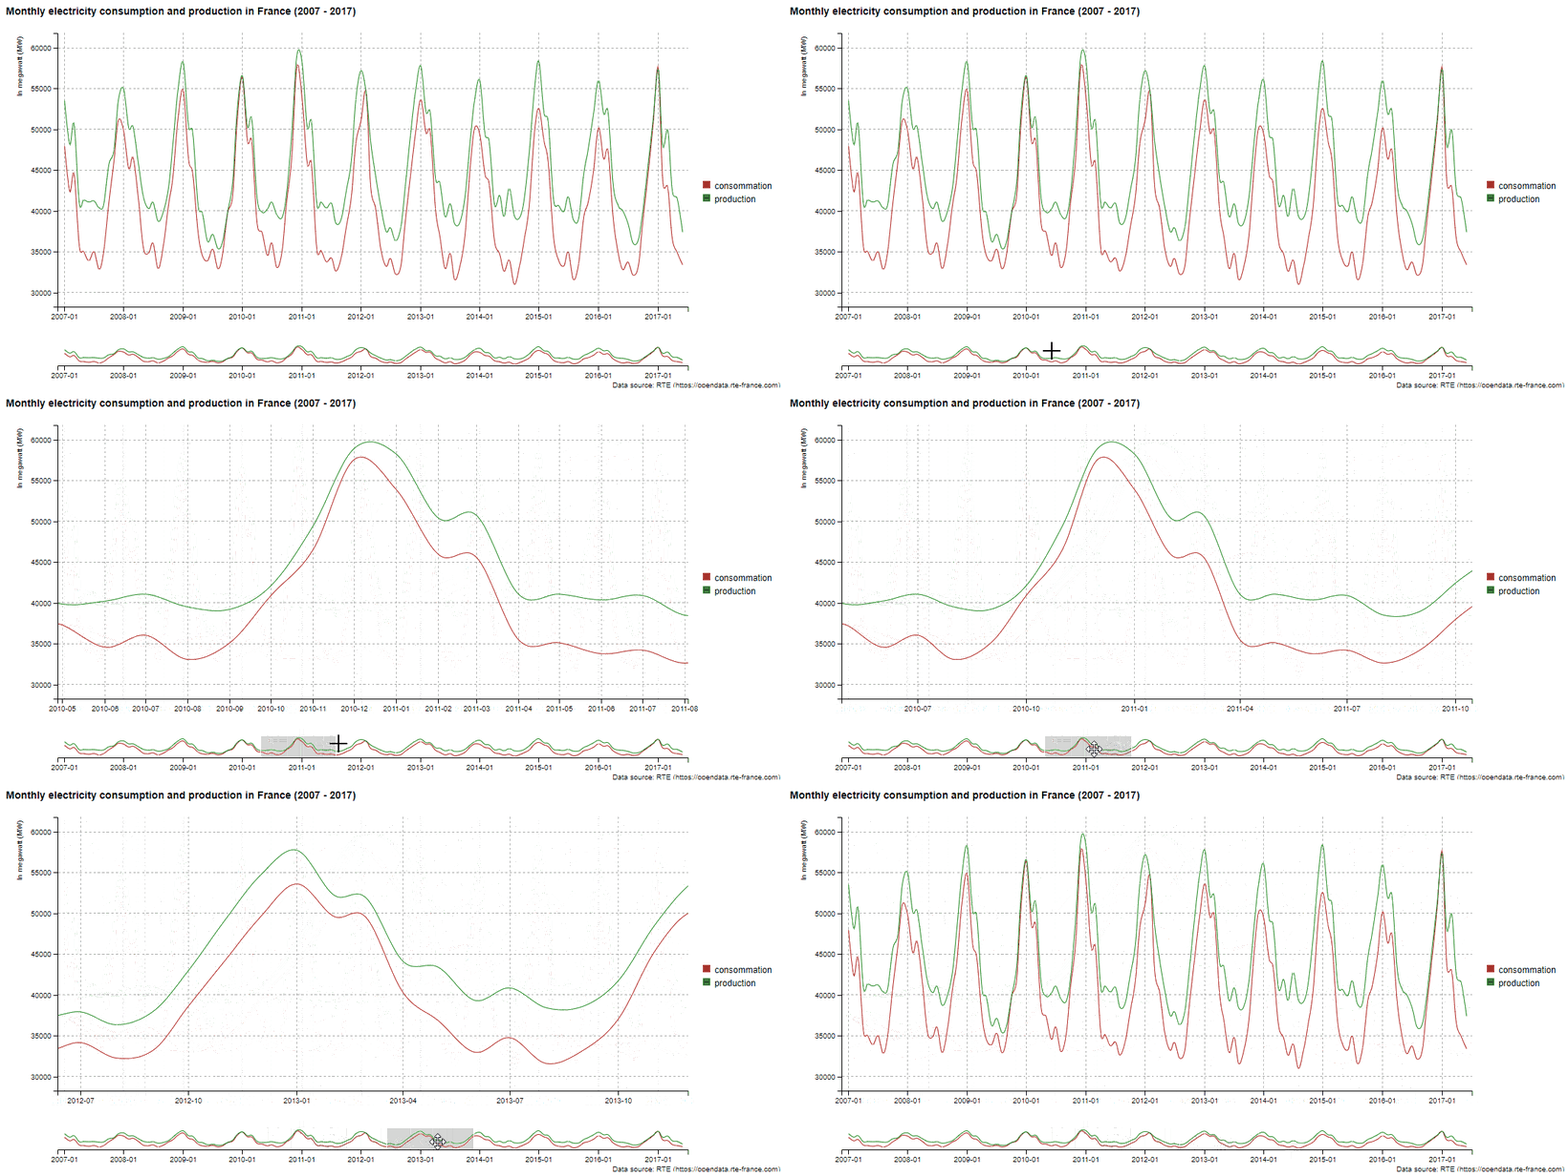
Time serie with Date (and a subchart)
library("billboarder")

# data
data("equilibre_mensuel")

# line chart
billboarder() %>%
  bb_linechart(
    data = equilibre_mensuel[, c("date", "consommation", "production")],
    type = "spline"
  ) %>%
  bb_x_axis(tick = list(format = "%Y-%m", fit = FALSE)) %>%
  bb_x_grid(show = TRUE) %>%
  bb_y_grid(show = TRUE) %>%
  bb_colors_manual("consommation" = "firebrick", "production" = "forestgreen") %>%
  bb_legend(position = "right") %>%
  bb_subchart(show = TRUE, size = list(height = 30)) %>%
  bb_labs(title = "Monthly electricity consumption and production in France (2007 - 2017)",
          y = "In megawatt (MW)",
          caption = "Data source: RTE (https://opendata.rte-france.com)")
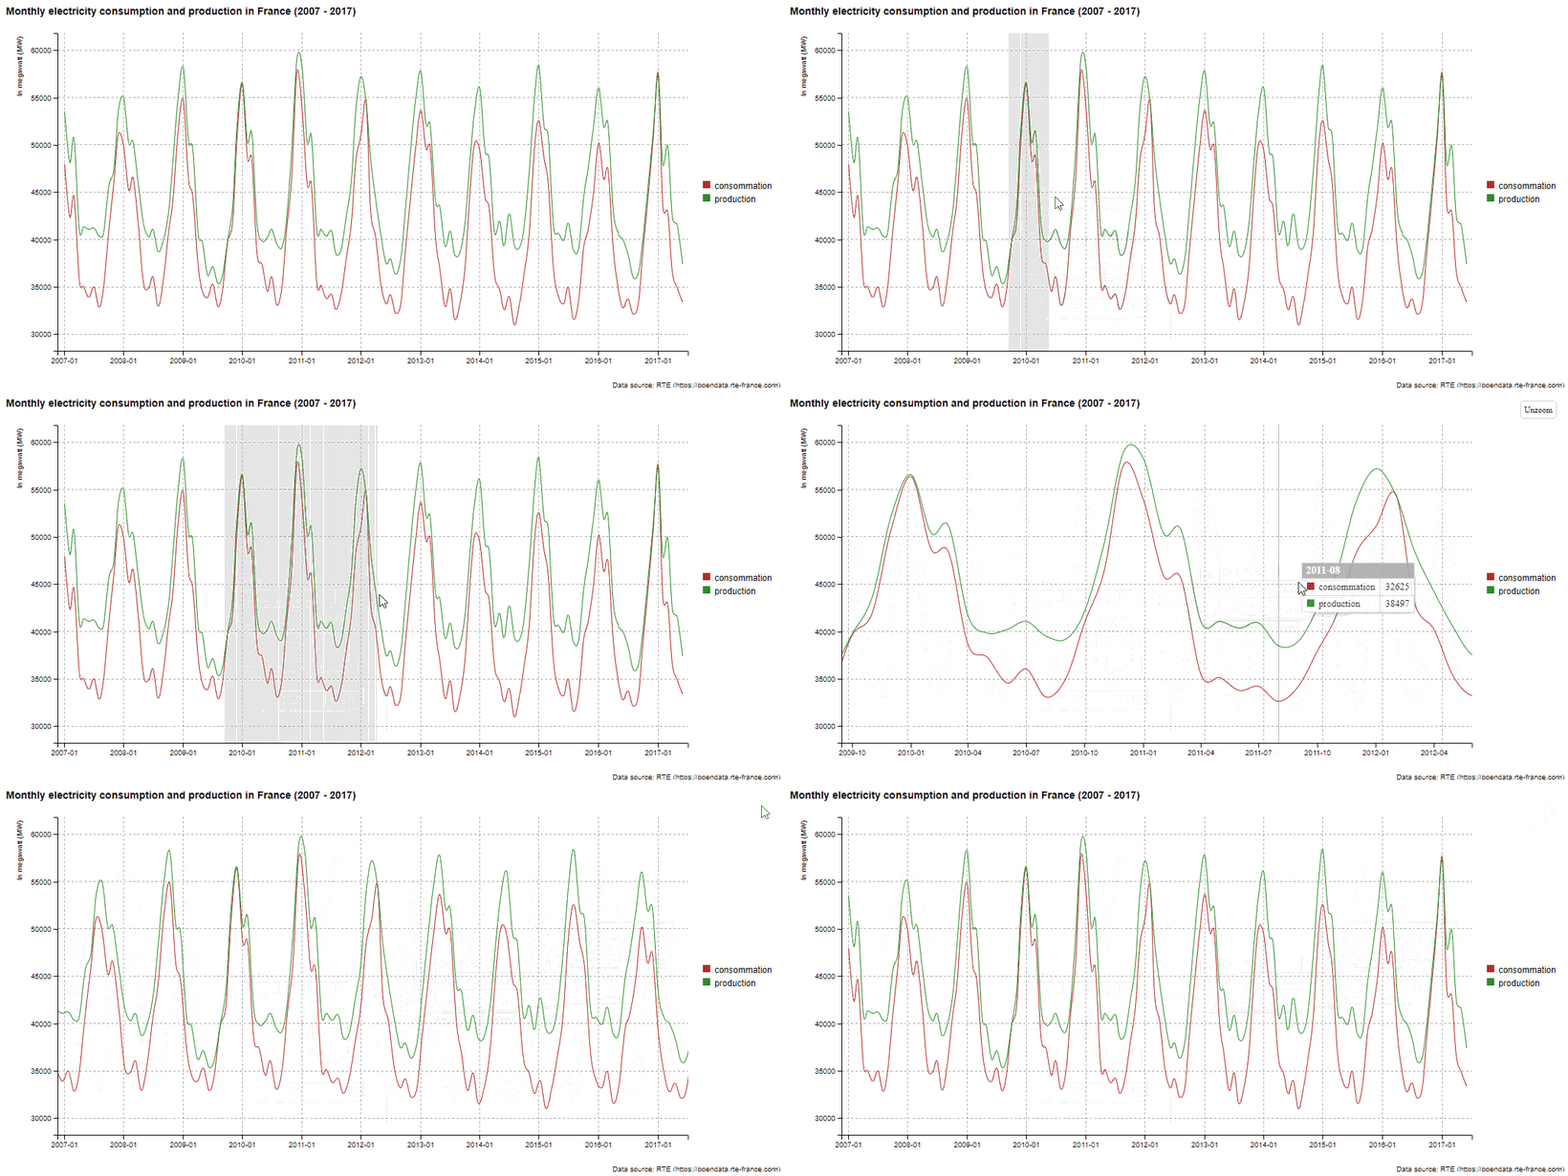
Zoom by dragging
billboarder() %>%
  bb_linechart(
    data = equilibre_mensuel[, c("date", "consommation", "production")],
    type = "spline"
  ) %>%
  bb_x_axis(tick = list(format = "%Y-%m", fit = FALSE)) %>%
  bb_x_grid(show = TRUE) %>%
  bb_y_grid(show = TRUE) %>%
  bb_colors_manual("consommation" = "firebrick", "production" = "forestgreen") %>%
  bb_legend(position = "right") %>%
  bb_zoom(
    enabled = list(type = "drag"),
    resetButton = list(text = "Unzoom")
  ) %>%
  bb_labs(title = "Monthly electricity consumption and production in France (2007 - 2017)",
          y = "In megawatt (MW)",
          caption = "Data source: RTE (https://opendata.rte-france.com)")
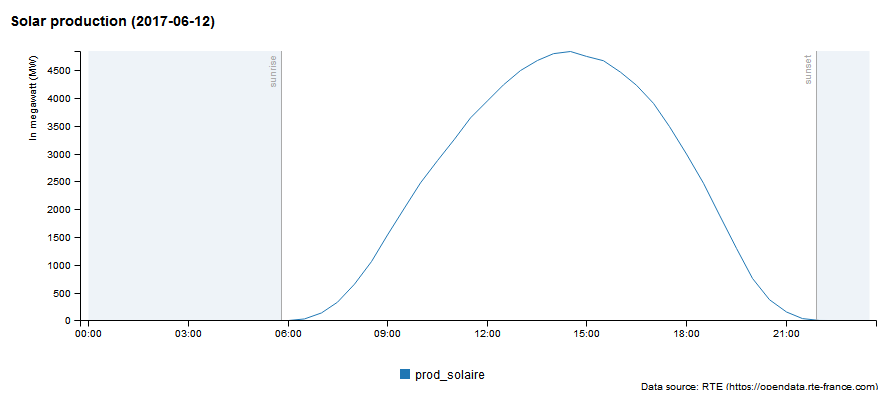
Time serie with POSIXct (and regions)
library("billboarder")

# data
data("cdc_prod_filiere")

# Retrieve sunrise and and sunset data with `suncalc`
library("suncalc")
sun <- getSunlightTimes(date = as.Date("2017-06-12"), lat = 48.86, lon = 2.34, tz = "CET")


# line chart
billboarder() %>%
  bb_linechart(data = cdc_prod_filiere[, c("date_heure", "prod_solaire")]) %>%
  bb_x_axis(tick = list(format = "%H:%M", fit = FALSE)) %>%
  bb_y_axis(min = 0, padding = 0) %>%
  bb_regions(
    list(
      start = as.numeric(cdc_prod_filiere$date_heure[1]) * 1000,
      end = as.numeric(sun$sunrise)*1000
    ),
    list(
      start = as.numeric(sun$sunset) * 1000,
      end = as.numeric(cdc_prod_filiere$date_heure[48]) * 1000
    )
  ) %>%
  bb_x_grid(
    lines = list(
      list(value = as.numeric(sun$sunrise)*1000, text = "sunrise"),
      list(value = as.numeric(sun$sunset)*1000, text = "sunset")
    )
  ) %>%
  bb_labs(title = "Solar production (2017-06-12)",
          y = "In megawatt (MW)",
          caption = "Data source: RTE (https://opendata.rte-france.com)")
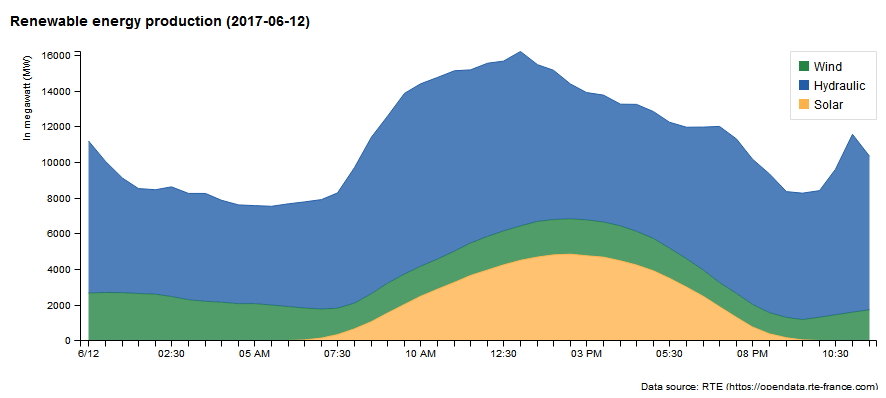
Stacked area chart
library("billboarder")

# data
data("cdc_prod_filiere")

# area chart !
billboarder() %>%
  bb_linechart(
    data = cdc_prod_filiere[, c("date_heure", "prod_eolien", "prod_hydraulique", "prod_solaire")],
    type = "area"
  ) %>%
  bb_data(
    groups = list(list("prod_eolien", "prod_hydraulique", "prod_solaire")),
    names = list("prod_eolien" = "Wind", "prod_hydraulique" = "Hydraulic", "prod_solaire" = "Solar")
  ) %>%
  bb_legend(position = "inset", inset = list(anchor = "top-right")) %>%
  bb_colors_manual(
    "prod_eolien" = "#238443", "prod_hydraulique" = "#225EA8", "prod_solaire" = "#FEB24C",
    opacity = 0.8
  ) %>%
  bb_y_axis(min = 0, padding = 0) %>%
  bb_labs(title = "Renewable energy production (2017-06-12)",
          y = "In megawatt (MW)",
          caption = "Data source: RTE (https://opendata.rte-france.com)")
Line range
Don't work in RStudio viewer... Open in browser.
# Generate data
dat <- data.frame(
  date = seq.Date(Sys.Date(), length.out = 20, by = "day"),
  y1 = round(rnorm(20, 100, 15)),
  y2 = round(rnorm(20, 100, 15))
)
dat$ymin1 <- dat$y1 - 5
dat$ymax1 <- dat$y1 + 5

dat$ymin2 <- dat$y2 - sample(3:15, 20, TRUE)
dat$ymax2 <- dat$y2 + sample(3:15, 20, TRUE)


# Make chart : use ymin & ymax aes for range
billboarder(data = dat) %>%
  bb_linechart(
    mapping = bbaes(x = date, y = y1, ymin = ymin1, ymax = ymax1),
    type = "area-line-range"
  ) %>%
  bb_linechart(
    mapping = bbaes(x = date, y = y2, ymin = ymin2, ymax = ymax2),
    type = "area-spline-range"
  ) %>%
  bb_y_axis(min = 50)
Histogram & density
You can do histograms !
billboarder() %>%
  bb_histogram(data = rnorm(1e5), binwidth = 0.25) %>%
  bb_colors_manual()
With a grouping variable :
# Generate some data
dat <- data.frame(
  sample = c(rnorm(n = 1e4, mean = 1), rnorm(n = 1e4, mean = 2)),
  group = rep(c("A", "B"), each = 1e4), stringsAsFactors = FALSE
)
# Mean by groups
samples_mean <- tapply(dat$sample, dat$group, mean)
# histogram !
billboarder() %>%
  bb_histogram(data = dat, x = "sample", group = "group", binwidth = 0.25) %>%
  bb_x_grid(
    lines = list(
      list(value = unname(samples_mean['A']), text = "mean of sample A"),
      list(value = unname(samples_mean['B']), text = "mean of sample B")
    )
  )
Density plot with the same data :
billboarder() %>%
  bb_densityplot(data = dat, x = "sample", group = "group") %>%
  bb_x_grid(
    lines = list(
      list(value = unname(samples_mean['A']), text = "mean of sample A"),
      list(value = unname(samples_mean['B']), text = "mean of sample B")
    )
  )
Shiny interaction
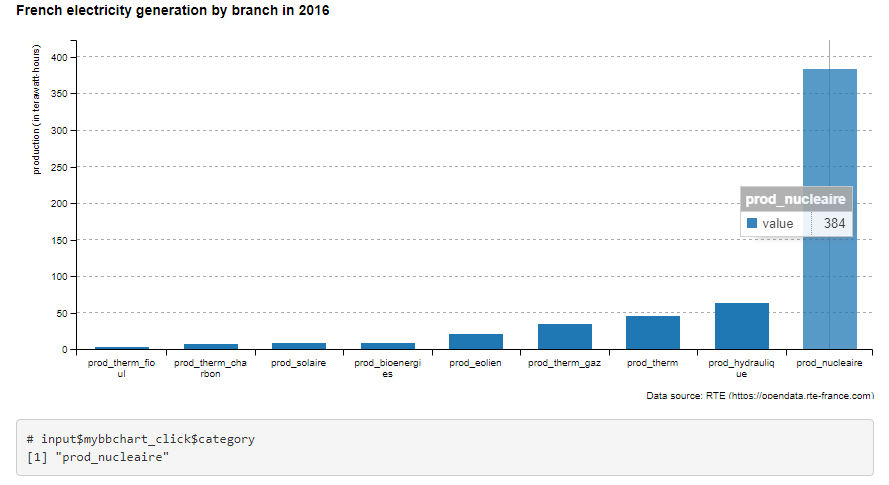
Some events will trigger Shiny's inputs in application, such as click. Inputs id associated with billboarder charts use this pattern :
input$CHARTID_EVENT
Look at this example, chart id is mybbchart so you retrieve click with input$mybbchart_click :
library("shiny")
library("billboarder")

# data
data("prod_par_filiere")
prod_par_filiere_l <- reshape2::melt(data = prod_par_filiere)
prod_par_filiere_l <- prod_par_filiere_l[
  with(prod_par_filiere_l, annee == "2016" & variable != "prod_total"), 2:3
]
prod_par_filiere_l <- prod_par_filiere_l[order(prod_par_filiere_l$value), ]


# app
ui <- fluidPage(
  billboarderOutput(outputId = "mybbchart"),
  br(),
  verbatimTextOutput(outputId = "click")
)

server <- function(input, output, session) {

  output$mybbchart <- renderBillboarder({
    billboarder() %>%
      bb_barchart(data = prod_par_filiere_l) %>%
      bb_y_grid(show = TRUE) %>%
      bb_legend(show = FALSE) %>%
      bb_x_axis(categories = prod_par_filiere_l$variable, fit = FALSE) %>%
      bb_labs(title = "French electricity generation by branch in 2016",
              y = "production (in terawatt-hours)",
              caption = "Data source: RTE (https://opendata.rte-france.com)")
  })

  output$click <- renderPrint({
    cat("# input$mybbchart_click$category", "\n")
    input$mybbchart_click$category
  })

}

shinyApp(ui = ui, server = server)
Proxy
You can modify existing charts with function billboarderProxy :
To see examples, run :
library("billboarder")
proxy_example("bar")
proxy_example("line")
proxy_example("pie")
proxy_example("gauge")
Raw API
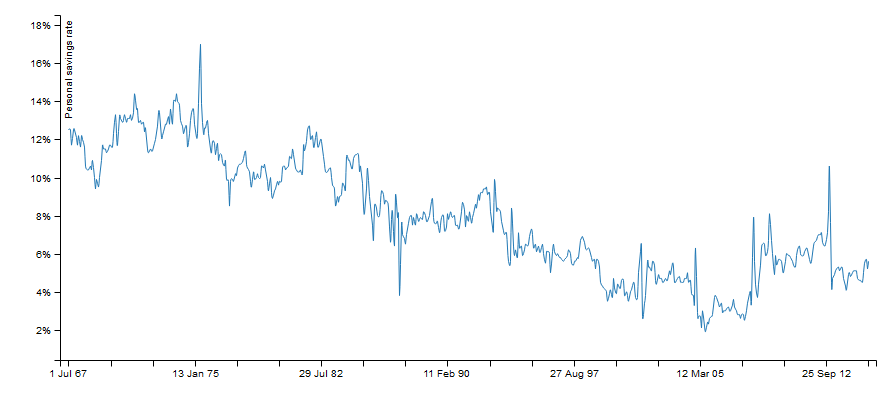
If what you want to do is not possible with higher function in the package, you can anyway do what you want, you just have to pass a list-JSON as parameter :
data(economics, package = "ggplot2")

# Construct a list in JSON format
params <- list(
  data = list(
    x = "x",
    json = list(
      x = economics$date,
      y = economics$psavert
    ),
    type = "spline"
  ),
  legend = list(show = FALSE),
  point = list(show = FALSE),
  axis = list(
    x = list(
      type = "timeseries",
      tick = list(
        count = 20,
        fit = TRUE,
        format = "%e %b %y"
      )
    ),
    y = list(
      label = list(
        text = "Personal savings rate"
      ),
      tick = list(
        format = htmlwidgets::JS("function(x) {return x + '%';}")
      )
    )
  )
)

# Pass the list as parameter
billboarder(params)

