cloudflare / Unsee
Programming Languages
Projects that are alternatives of or similar to Unsee
unsee
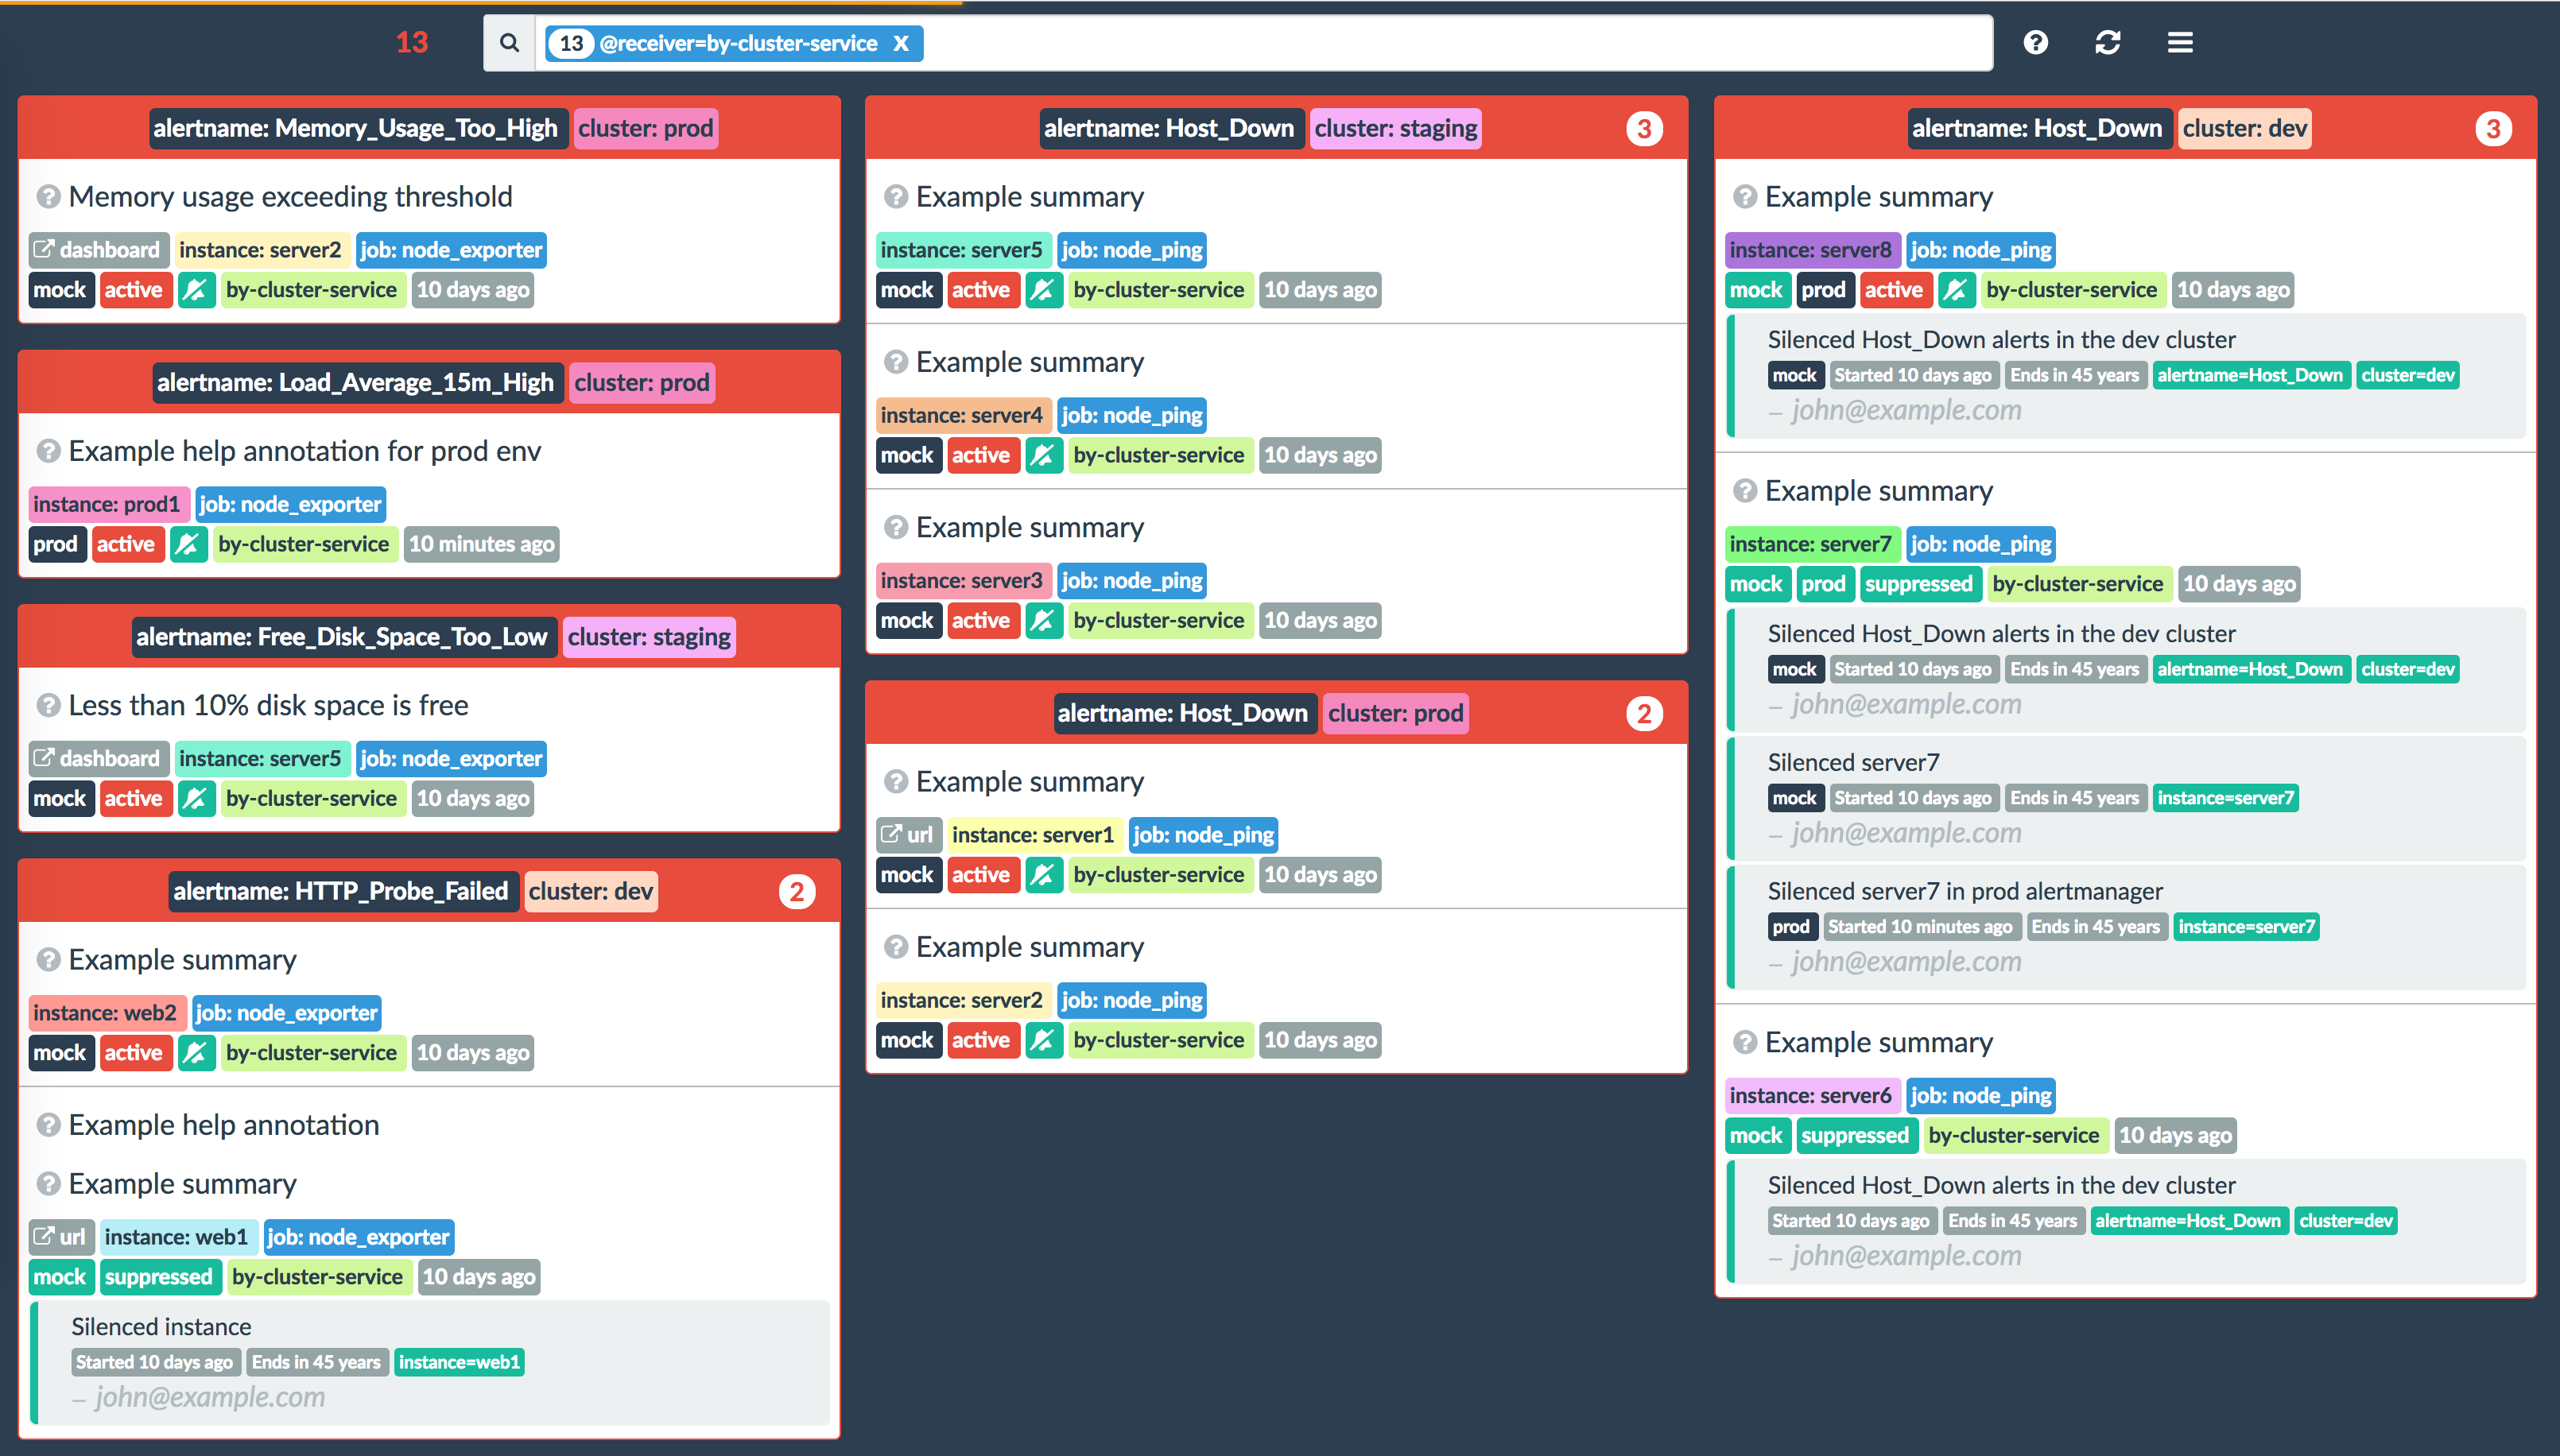
Alert dashboard for Prometheus Alertmanager.
Alertmanager UI is useful for browsing alerts and managing silences, but it's
lacking as a dashboard tool - unsee aims to fill this gap.
Starting with 0.7.0 release it can also aggregate alerts from multiple
Alertmanager instances, running either in HA mode or separate. Duplicated alerts
are deduplicated so only unique alerts are displayed. Each alert is tagged with
names of all Alertmanager instances it was found at and can be filtered based
on those tags.
To get notifications about new unsee releases you can subscribe to the RSS feed that GitHub provides To get email notifications please use one of the free services providing RSS to email notifications, like Blogtrottr.
Supported Alertmanager versions
Alertmanager's API isn't stable yet and can change between releases, see
VERSIONS in internal/mock/Makefile for list of all
Alertmanager releases that are tested and supported by unsee.
Due to API differences between those releases some features will work
differently or be missing, it's recommended to use the latest supported
Alertmanager version.
Security
The unsee process doesn't send any API request to the Alertmanager that could modify alerts or silence state, but it does provide a web interface that allows a user to send such requests directly to the Alertmanager API. If you wish to deploy unsee as a read-only tool please ensure that:
- the unsee process is able to connect to the Alertmanager API
- read-only users are able to connect to the unsee web interface
- read-only users are NOT able to connect to the Alertmanager API
Metrics
unsee process metrics are accessible under /metrics path by default.
If you set the --listen.prefix option a path relative to it will be
used.
Building and running
Building from source
To clone git repo and build the binary yourself run:
git clone https://github.com/cloudflare/unsee $GOPATH/src/github.com/cloudflare/unsee
cd $GOPATH/src/github.com/cloudflare/unsee
To finally compile unsee the binary run:
make
Note that building locally from sources requires Go, nodejs and npm. See Docker build options below for instructions on building from withing docker container.
Running
unsee can be configured using config file, command line flags or environment
variables. Config file is the recommended method, it's also the only way to
configure unsee to use multiple Alertmanager servers for collecting alerts.
To run unsee with a single Alertmanager server set ALERTMANAGER_URI
environment variable or pass --alertmanger.uri flag on the command line, with
Alertmanager URI as argument, example:
ALERTMANAGER_URI=https://alertmanager.example.com unsee
unsee --alertmanager.uri https://alertmanager.example.com
There is a make target which will compile and run unsee:
make run
By default it will listen on port 8080 and Alertmanager mock data will be
used, to override Alertmanager URI set ALERTMANAGER_URI and/or PORT make
variables. Example:
make PORT=5000 ALERTMANAGER_URI=https://alertmanager.example.com run
Docker
Running pre-build docker image
Official docker images are built and hosted on hub.docker.com.
Images are built automatically for:
- release tags in git -
cloudflare/unsee:vX.Y.Z - master branch commits -
cloudflare/unsee:latest
Examples
To start a release image run:
docker run -e ALERTMANAGER_URI=https://alertmanager.example.com cloudflare/unsee:vX.Y.Z
Latest release details can be found on GitHub.
To start docker image build from lastet master branch run:
docker run -e ALERTMANAGER_URI=https://alertmanager.example.com cloudflare/unsee:latest
Note that latest master branch might have bugs or breaking changes. Using release images is strongly recommended for any production use.
Building a Docker image
make docker-image
This will build a Docker image from sources.
Running the Docker image
make run-docker
Will run locally built Docker image. Same defaults and override variables
apply as with make run. Example:
make PORT=5000 ALERTMANAGER_URI=https://alertmanager.example.com run-docker
Configuration
Please see CONFIGURATION for full list of available configuration options and example.yaml for a config file example.
Contributing
Please see CONTRIBUTING for details.
License
Apache License 2.0, please see LICENSE.

