All Projects → mattrco → Anode

mattrco / Anode

Licence: apache-2.0
Utility for analyzing graphite metrics. Experimental package.

Programming Languages

go
31211 projects - #10 most used programming language

Projects that are alternatives of or similar to Anode

gateway
A proxy to buffer and forward metrics, events, and traces.
Stars: ✭ 94 (-50%)
Mutual labels:  metrics, graphite, observability
Graphite exporter
Server that accepts metrics via the Graphite protocol and exports them as Prometheus metrics
Stars: ✭ 217 (+15.43%)
Mutual labels:  metrics, observability, graphite
Myperf4j
High performance Java APM. Powered by ASM. Try it. Test it. If you feel its better, use it.
Stars: ✭ 2,281 (+1113.3%)
Mutual labels:  metrics, observability
Tessera
A dashboard front-end for graphite.
Stars: ✭ 1,202 (+539.36%)
Mutual labels:  metrics, graphite
Es Stats
ElasticSearch cluster metrics -> Graphite
Stars: ✭ 91 (-51.6%)
Mutual labels:  metrics, graphite
Whisper
Whisper is a file-based time-series database format for Graphite.
Stars: ✭ 1,121 (+496.28%)
Mutual labels:  metrics, graphite
Graylog Plugin Metrics Reporter
Graylog Metrics Reporter Plugins
Stars: ✭ 71 (-62.23%)
Mutual labels:  metrics, graphite
Influxgraph
Graphite InfluxDB backend. InfluxDB storage finder / plugin for Graphite API.
Stars: ✭ 87 (-53.72%)
Mutual labels:  metrics, graphite
Vector
A reliable, high-performance tool for building observability data pipelines.
Stars: ✭ 8,736 (+4546.81%)
Mutual labels:  metrics, observability
Icinga2
Icinga is a monitoring system which checks the availability of your network resources, notifies users of outages, and generates performance data for reporting.
Stars: ✭ 1,670 (+788.3%)
Mutual labels:  metrics, graphite
Carbon
Carbon is one of the components of Graphite, and is responsible for receiving metrics over the network and writing them down to disk using a storage backend.
Stars: ✭ 1,435 (+663.3%)
Mutual labels:  metrics, graphite
Go Http Metrics
Go modular http middleware to measure HTTP requests independent of metrics backend (with Prometheus and OpenCensus as backend implementations) and http framework/library
Stars: ✭ 128 (-31.91%)
Mutual labels:  metrics, observability
Graphyte
Python 3 compatible library to send data to a Graphite metrics server (Carbon)
Stars: ✭ 59 (-68.62%)
Mutual labels:  metrics, graphite
Vsphere2metrics
VMware vSphere Performance Metrics Integration with Graphite & InfluxDB
Stars: ✭ 28 (-85.11%)
Mutual labels:  metrics, graphite
Jmx2graphite
JMX to Graphite every x seconds in one command line (Docker based) (also come in Java Agent flavour)
Stars: ✭ 75 (-60.11%)
Mutual labels:  metrics, graphite
Pirate
Realtime metrics server written in Go
Stars: ✭ 11 (-94.15%)
Mutual labels:  metrics, graphite
Hubble
Hubble - Network, Service & Security Observability for Kubernetes using eBPF
Stars: ✭ 1,245 (+562.23%)
Mutual labels:  metrics, observability
Influxdb exporter
A server that accepts InfluxDB metrics via the HTTP API and exports them via HTTP for Prometheus consumption
Stars: ✭ 159 (-15.43%)
Mutual labels:  metrics, observability
Docker Go Graphite
Docker image for go-carbon + carbonapi + grafana
Stars: ✭ 23 (-87.77%)
Mutual labels:  metrics, graphite
Logmonitor
Monitoring log files on windows systems.
Stars: ✭ 23 (-87.77%)
Mutual labels:  metrics, graphite

Anode

Build Status

Anode is a tool for experimenting with different analysis algorithms on metrics and other time series. You can read an extended introduction to anode here.

Data analysis starts with getting to know your data. The overarching goal of anode is to advance the open-source offerings for metrics analysis by creating a proving ground for different approaches.

Anode ships with a Graphite input plugin, capable of fetching a named metric from graphite and streaming updates to registered analysis plugins. Each analysis plugin then streams its result to output plugins.

Just learning about metrics analysis? Have a look at this excellent talk on anomaly detection for metrics.

Example

A three sigma analyzer is included. This works best for data with a normal (gaussian) distribution.

go get github.com/mattrco/anode
anode -metric=app.latency

(Other flags exist; see here).

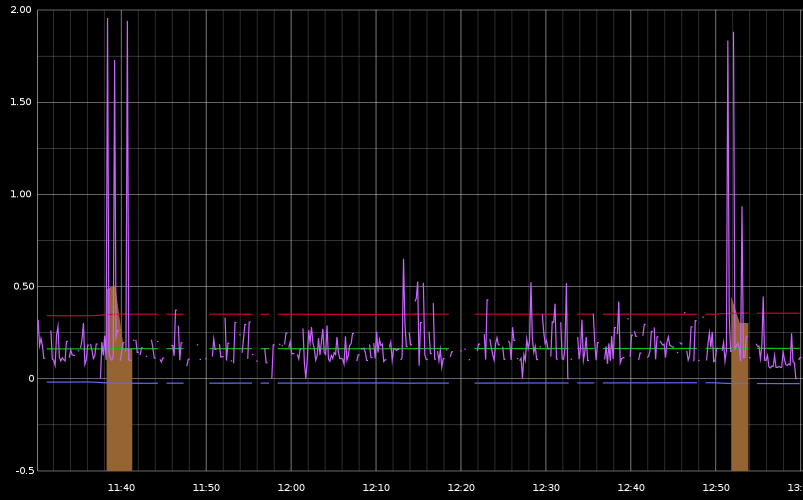
This will fetch and process the last 24 hours of data. New metrics will appear in graphite under anode.threesig which you can then plot alongside your existing metric. The screenshot below shows the original metric (lilac) with anomalous values highlighted in orange.

Screenshot of Three Sigma analyzer

Contributions

Contributions welcome! Please open an issue to discuss what you'd like to work on.

Related projects and acknowledgement

mozilla-services/heka

Heka is a more general data collection and processing system, processing much more than time series. Its data pipeline inspired anode's architecture.

etsy/skyline

Skyline is an anomaly detection system for time series data.

Key differences:

  • Skyline is production-ready and more work to get set up
  • Fairly rigid decision logic for determining whether latest updates to a series are anomalous. Algorithms each return a boolean and majority vote wins. There's no way to apply different analyses to different metrics, which is a key design point of anode.

Copyright Notice and License

Copyright 2014 Matthew ("Matt") Cottingham

Licensed under the Apache License, Version 2.0 (the "License"); you may not use this software except in compliance with the License. You may obtain a copy of the License at

http://www.apache.org/licenses/LICENSE-2.0

Unless required by applicable law or agreed to in writing, software distributed under the License is distributed on an "AS IS" BASIS, WITHOUT WARRANTIES OR CONDITIONS OF ANY KIND, either express or implied. See the License for the specific language governing permissions and limitations under the License.

Note that the project description data, including the texts, logos, images, and/or trademarks, for each open source project belongs to its rightful owner. If you wish to add or remove any projects, please contact us at [email protected].