jwkvam / Celluloid
Licence: mit
🎥 Matplotlib animations made easy
Stars: ✭ 867
Programming Languages
python
139335 projects - #7 most used programming language
Labels
Projects that are alternatives of or similar to Celluloid
Mpl Scatter Density
⚡️ Fast scatter density plots for Matplotlib ⚡️
Stars: ✭ 413 (-52.36%)
Mutual labels: matplotlib
Mexican Government Report
Text Mining on the 2019 Mexican Government Report, covering from extracting text from a PDF file to plotting the results.
Stars: ✭ 473 (-45.44%)
Mutual labels: matplotlib
Adjusttext
A small library for automatically adjustment of text position in matplotlib plots to minimize overlaps.
Stars: ✭ 731 (-15.69%)
Mutual labels: matplotlib
Colorcet
A set of useful perceptually uniform colormaps for plotting scientific data
Stars: ✭ 438 (-49.48%)
Mutual labels: matplotlib
Data Science Ipython Notebooks
Data science Python notebooks: Deep learning (TensorFlow, Theano, Caffe, Keras), scikit-learn, Kaggle, big data (Spark, Hadoop MapReduce, HDFS), matplotlib, pandas, NumPy, SciPy, Python essentials, AWS, and various command lines.
Stars: ✭ 22,048 (+2443.02%)
Mutual labels: matplotlib
Pyheat
pprofile + matplotlib = Python program profiled as an awesome heatmap!
Stars: ✭ 491 (-43.37%)
Mutual labels: matplotlib
Stats Maths With Python
General statistics, mathematical programming, and numerical/scientific computing scripts and notebooks in Python
Stars: ✭ 381 (-56.06%)
Mutual labels: matplotlib
Moonchart
Performance tear sheets and backtest analysis for Moonshot
Stars: ✭ 19 (-97.81%)
Mutual labels: matplotlib
Pynamical
Pynamical is a Python package for modeling and visualizing discrete nonlinear dynamical systems, chaos, and fractals.
Stars: ✭ 458 (-47.17%)
Mutual labels: matplotlib
Subreddit Analyzer
A comprehensive Data and Text Mining workflow for submissions and comments from any given public subreddit.
Stars: ✭ 447 (-48.44%)
Mutual labels: matplotlib
Baby Names Analysis
Data ETL & Analysis on the dataset 'Baby Names from Social Security Card Applications - National Data'.
Stars: ✭ 557 (-35.76%)
Mutual labels: matplotlib
Chartpy
Easy to use Python API wrapper to plot charts with matplotlib, plotly, bokeh and more
Stars: ✭ 426 (-50.87%)
Mutual labels: matplotlib
Vapeplot
matplotlib extension for vaporwave aesthetics
Stars: ✭ 483 (-44.29%)
Mutual labels: matplotlib
Cartopy
Cartopy - a cartographic python library with matplotlib support
Stars: ✭ 857 (-1.15%)
Mutual labels: matplotlib
Geoplot
High-level geospatial data visualization library for Python.
Stars: ✭ 897 (+3.46%)
Mutual labels: matplotlib
Youtube Report
📊 Generate a personal YouTube report from your Google Takeout data
Stars: ✭ 607 (-29.99%)
Mutual labels: matplotlib
celluloid

![]()
![]()

Easy Matplotlib Animation
Creating animations should be easy. This module makes it easy to adapt your existing visualization code to create an animation.
Install
pip install celluloid
Manual
Follow these steps:
- Create a matplotlib
Figureand create aCamerafrom it:
from celluloid import Camera
fig = plt.figure()
camera = Camera(fig)
- Reusing the figure and after each frame is created, take a snapshot with the camera.
plt.plot(...)
plt.fancy_stuff()
camera.snap()
- After all frames have been captured, create the animation.
animation = camera.animate()
animation.save('animation.mp4')
The entire module is less than 50 lines of code.
Viewing in Jupyter Notebooks
View videos in notebooks with IPython.
from IPython.display import HTML
animation = camera.animate()
HTML(animation.to_html5_video())
Examples
Minimal
As simple as it gets.
from matplotlib import pyplot as plt
from celluloid import Camera

fig = plt.figure()
camera = Camera(fig)
for i in range(10):
    plt.plot([i] * 10)
    camera.snap()
animation = camera.animate()

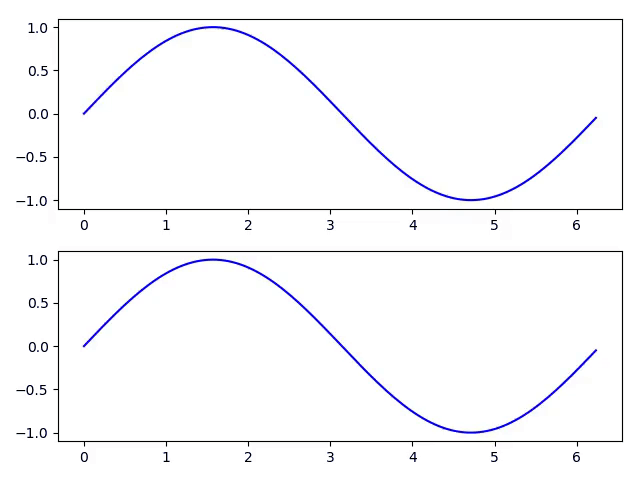
Subplots
Animation at the top.
import numpy as np
from matplotlib import pyplot as plt
from celluloid import Camera

fig, axes = plt.subplots(2)
camera = Camera(fig)
t = np.linspace(0, 2 * np.pi, 128, endpoint=False)
for i in t:
    axes[0].plot(t, np.sin(t + i), color='blue')
    axes[1].plot(t, np.sin(t - i), color='blue')
    camera.snap()
animation = camera.animate()
Images
Domain coloring example.
import numpy as np
from matplotlib import pyplot as plt
from matplotlib.colors import hsv_to_rgb

from celluloid import Camera

fig = plt.figure()
camera = Camera(fig)

for a in np.linspace(0, 2 * np.pi, 30, endpoint=False):
    x = np.linspace(-3, 3, 800)
    X, Y = np.meshgrid(x, x)
    x = X + 1j * Y
    y = (x ** 2 - 2.5) * (x - 2.5 * 1j) * (x + 2.5 * 1j) \
        * (x - 2 - 1j) ** 2 / ((x - np.exp(1j * a)) ** 2
        * (x - np.exp(1j * 2 * a)) ** 2)

    H = np.angle(y) / (2 * np.pi) + .5
    r = np.log2(1. + np.abs(y))
    S = (1. + np.abs(np.sin(2. * np.pi * r))) / 2.
    V = (1. + np.abs(np.cos(2. * np.pi * r))) / 2.

    rgb = hsv_to_rgb(np.dstack((H, S, V)))
    ax.imshow(rgb)
    camera.snap()
animation = camera.animate()

Legends
import matplotlib
from matplotlib import pyplot as plt
from celluloid import Camera

fig = plt.figure()
camera = Camera(fig)
for i in range(5):
    t = plt.plot(range(i, i + 5))
    plt.legend(t, [f'line {i}'])
    camera.snap()
animation = camera.animate()

Limitations
- The axes' limits should be the same for all plots. The limits of the animation will be the limits of the final plot.
- Legends will accumulate from previous frames. Pass the artists to the
legendfunction to draw them separately. - Animating the title does not work. As a workaround you can create a text object:
ax.text(0.5, 1.01, 'computed title', transform=ax.transAxes)
- This can demand a lot of memory since it uses
ArtistAnimationunder the hood. This means that all artists are saved to memory before the animation is constructed. - This is a black box. If you want to understand how matplotlib animations work, using this library may hinder you. If you want to be an expert matplotlib user, you may want to pass on this library.
Credits
Inspired by plotnine.
Note that the project description data, including the texts, logos, images, and/or trademarks,
for each open source project belongs to its rightful owner.
If you wish to add or remove any projects, please contact us at [email protected].